
55 PV Plants Surveyed: Is One in Five Modules Cracked? How to Read the Numbers
A field survey published in the SPIE/GEESD 2026 proceedings covers 55 PV plants across six regions of China. EL imaging found an average microcrack proportion of 19.92%, while UAV infrared inspection found an average hot-spot proportion of 1.51%. Both rise significantly with years in service; mountain plants show the most microcracks, agrivoltaic plants the most hot spots, and Northwest China ranks highest on both. We comment from three angles: data definitions, cell technology, and O&M/warranty practice.
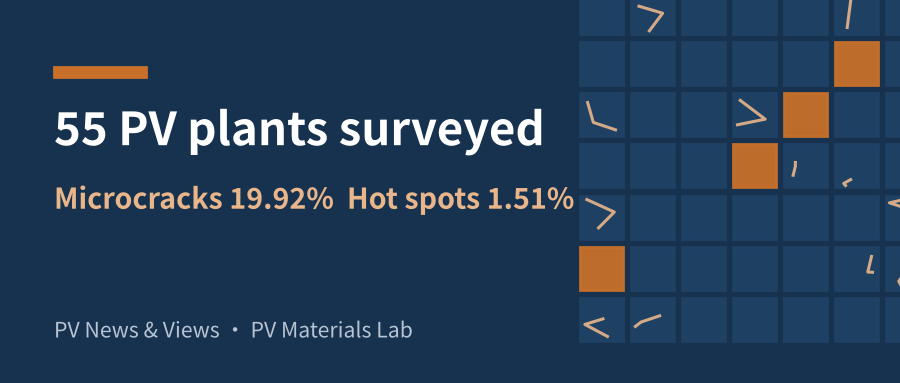
Microcracks and hot spots are the two most common field defects in PV modules, and among the hardest to settle in disputes: modules leave the factory with clean EL images, yet a few years later a drone flight reveals problems. A recent conference paper reports a randomized survey of 55 PV plants in China and provides a rare set of field baseline data. In this issue we summarize its findings and share our view.
01 What the survey did
The authors randomly selected 55 plants of different ages and types across Northwest, Northeast, North, East, South and Central China. Inspection followed two tracks:
- Microcracks: 29 plants were inspected with electroluminescence (EL) imaging to reveal cracks inside the cells;
- Hot spots: 33 plants were inspected by UAV-mounted infrared cameras to find abnormal heating;
- Comparison dimensions: years in service, terrain (e.g. mountain), application (e.g. agrivoltaic) and region.
An important caveat: what we can verify is the abstract-level information. The cell technology (PERC/TOPCon/HJT) and the module BOM are not disclosed in the abstract, and our interpretation below rests on that premise.
02 Key numbers: about 20% microcracks, about 1.5% hot spots
| Metric | Microcracks (EL) | Hot spots (UAV + IR) |
|---|---|---|
| Plants inspected | 29 | 33 |
| Average proportion | 19.92% | 1.51% |
| Min – Max | 0.15% – 52.63% | 0.003% – 8.89% |
| Plants above threshold | 58.62% of plants > 10% | 40.54% of plants > 1% |
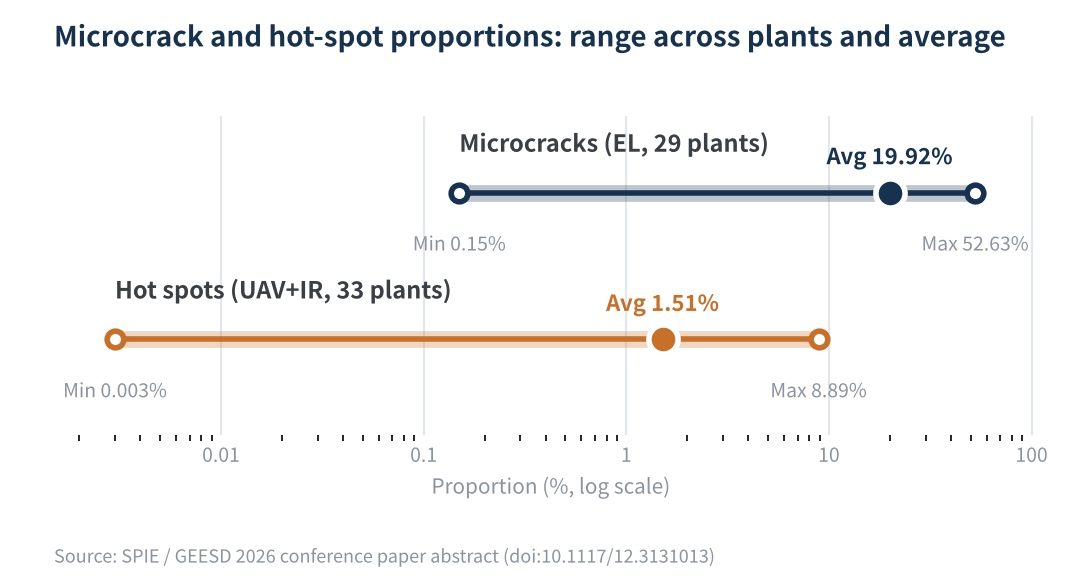
Figure 1 Microcrack and hot-spot proportions: range across plants and average (log scale)
Putting the two sets of numbers together, three things stand out:
- Microcracks are common: on average roughly one module in five shows cracks under EL, and more than half of the plants exceed 10%.
- Huge spread: the best plant has only 0.15% cracked modules, the worst more than half, a ratio of about 350x; for hot spots the ratio exceeds 2000x. The difference between plants matters far more than the average itself.
- Hot spots are an order of magnitude lower: a crack is not a hot spot. Most cracks do not turn into hot spots right away, but they are an important precondition.
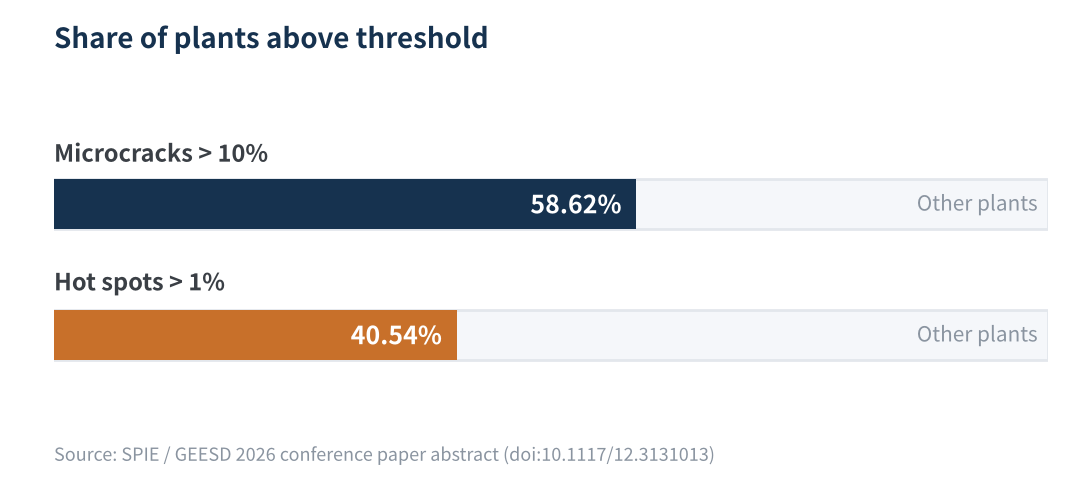
Figure 2 Share of plants above the microcrack and hot-spot thresholds
03 Three divides: age, terrain and application
- Age: both proportions rise significantly with years in service. This matches the crack life cycle of initiation, propagation and inactivation: repeated temperature swings, wind and snow loads grow small cracks into broken fingers and inactive areas, which heat up locally under high current.
- Terrain: mountain plants have the highest microcrack proportion, which the paper attributes to terrain and temperature differences. We would add that long, bumpy transport and handling routes and uneven foundations that twist the modules both create and amplify cracks.
- Application: agrivoltaic plants have the highest hot-spot proportion, attributed to crop effects. Local shading from growing crops, higher humidity under the modules and soiling can all trigger hot spots.
- Region: Northwest China has the highest average proportion of both defects. Large day-night temperature swings, strong irradiance, wind and dust shading are typical environmental stresses there.
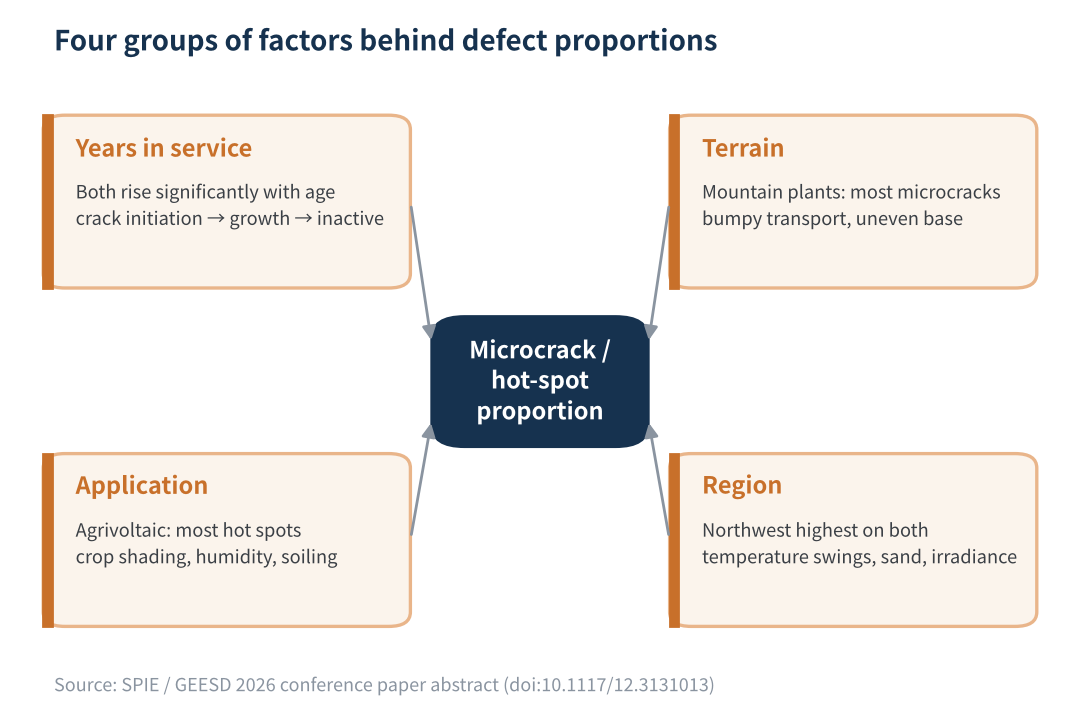
Figure 3 Four groups of factors behind microcrack and hot-spot proportions
Summary
Microcracks accumulate from mechanical and thermal stress; hot spots come from cracks plus shading plus time. Older plants, rougher terrain and more shading mean higher defect rates.
04 Our view: how to read the data without misreading it
This is a valuable field baseline. As a team with long experience in failure analysis and reliability, we suggest keeping four points in mind:
- Definitions: EL-visible cracks range from fine cracks with no inactive area to large inactive regions (often classified as mode A/B/C in the industry). Prior studies show that crack position, orientation and severity determine the impact on power, so a high crack proportion does not mean an equally high power loss.
- Cell technology: the abstract does not separate PERC, TOPCon and HJT, nor wafer thickness, multi-busbar vs 0BB, or glass-backsheet vs glass-glass. With thinner wafers and larger formats, this is exactly the breakdown we most want to see next.
- Internal consistency: 58.62% is exactly 17 of 29 plants, but 40.54% does not fit 33 plants (13/33 ≈ 39.4%, 14/33 ≈ 42.4%); it equals 15/37 instead. The actual number of plants in the hot-spot statistics may differ from 33 and should be checked against the full paper.
- Causality: the age trend also mixes in older module generations and older installation practices at older plants, so it is not purely an effect of time.
05 What it means for the industry
- Module makers: crack resistance should extend from passing factory EL to the full service life. With thinner wafers and larger formats, dynamic mechanical load and combined thermal-cycling plus mechanical-load sequences deserve more attention.
- Owners and O&M: EL sampling should not be one-size-fits-all. Set sampling rates by terrain, application, region and age: sample mountain, Northwest and older plants more often; rely on UAV infrared for hot spots and fly agrivoltaic plants more frequently.
- Warranty and claims: field baselines can serve as a reference for warranty and claim decisions, but only with unified test conditions and criteria (EL current, crack classification, IR temperature-difference threshold).
- Construction: transport, handling and installation on mountain projects are crack hot zones. Proper handling plus EL sampling on delivery and after installation costs less than assigning blame later.
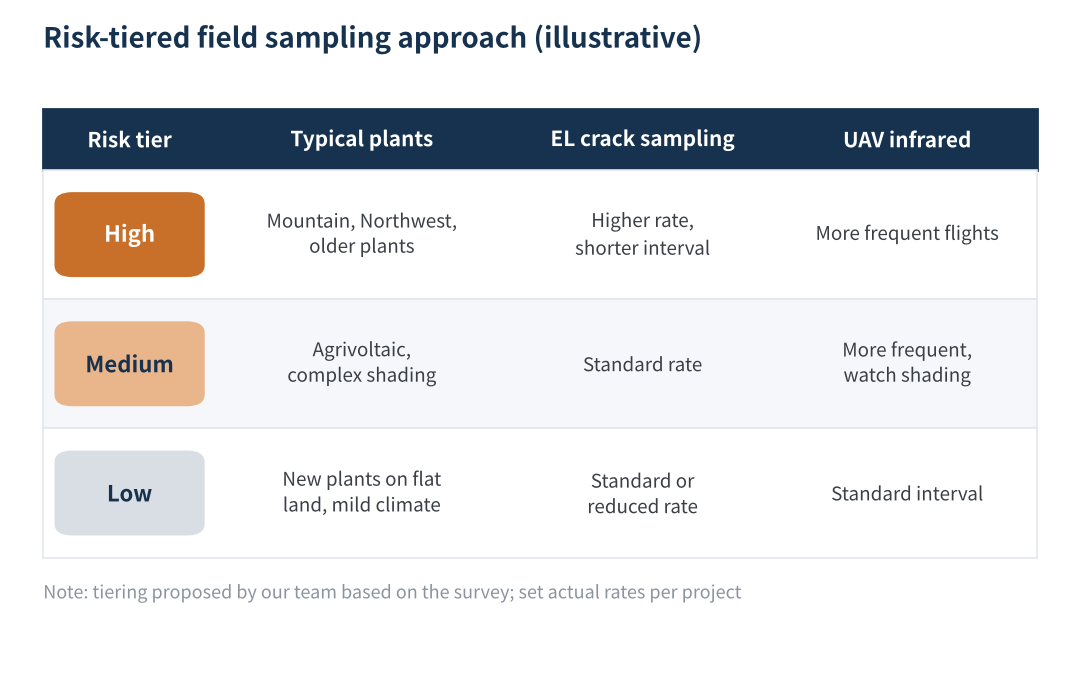
Figure 4 Risk-tiered field EL/IR sampling approach (illustrative)
06 Final thoughts
Numbers like “about 20% microcracks and 1.5% hot spots” look alarming, but the real value lies in the pattern behind them: defects are not evenly distributed; they follow age, terrain, application and region. We hope the authors will publish a breakdown by cell technology and BOM, which would be more instructive than the averages.
What crack proportion do you see in EL sampling at your own plants or projects? Share it in the comments.
Bottom line
Microcracks are common in PV plants and hot spots sit downstream of them; replacing average thinking with risk-tiered sampling is how this data should really be used.
Data definitions and calculations
- All data come from the paper's abstract (indexed by Crossref on 2026-10-19); we have not obtained the full text. The exact definition of “proportion” (per module or per cell) follows the original paper.
- Spread ratios: microcracks 52.63% ÷ 0.15% ≈ 351; hot spots 8.89% ÷ 0.003% ≈ 2963.
- Consistency check: 17/29 = 58.62%; 15/37 = 40.54%; 13/33 ≈ 39.39%, 14/33 ≈ 42.42%.
- Figure 4 is an illustrative approach proposed by our team based on the survey's conclusions; actual sampling rates should be set per project.
References
- Survey of microcracks and hot spots in modules at 55 PV power plants in China (conference paper). Proc. SPIE, GEESD 2026. https://doi.org/10.1117/12.3131013
- Köntges M., et al. Review of Failures of Photovoltaic Modules. IEA PVPS Task 13, Report T13-01:2014.
- Goudelis G., Lazaridis P. I., Dhimish M. A Review of Models for Photovoltaic Crack and Hotspot Prediction. Energies, 2022, 15(12): 4303. https://doi.org/10.3390/en15124303
- Dhimish M., Hu Y. Rapid testing on the effect of cracks on solar cells output power performance and thermal operation. Scientific Reports, 2022. https://doi.org/10.1038/s41598-022-16546-z
- Impact of cell cracks on performance of PV modules with current cell technologies. EPJ Photovoltaics, 2026.
- IEC TS 60904-13:2018 Photovoltaic devices – Part 13: Electroluminescence of photovoltaic modules.
PV Materials Lab · 光伏新材料研究所
PV Materials Lab (光伏新材料研究所)
A PV R&D and technology team with 10+ years of experience | In-depth technical knowledge sharing
Materials · Reliability · Failure Analysis · Standards & Certification · Products · Processes
Exploring AI + PV — collaboration welcome
Disclaimer:
1. Original content reflects the author's personal views only, is for reference, and does not constitute investment advice.
2. Reposted and cited content is credited to its source, with respect for original work.
3. Parts of this content are AI-assisted (chart generation, data retrieval, concept explanations, etc.); the core framework and key content are written by our technical team and reviewed by humans.
4. If anything is inaccurate or infringing, please leave a comment or contact us.