
PV PID Series #5 (Finale): Suspected PID in a Plant - How to Investigate, Recover and Prevent It
PV PID Series · Part 5 (finale)
On the monitoring platform, a few strings have quietly lost output, especially in the morning and evening. Is it PID? How do you confirm it, and what can you do once you have? In this final article of the series, we go back to the plant.
01Don't jump to conclusions: does it look like PID?
A plant can lose power for many reasons, and PID is only one of them. Fortunately, it has a few very distinctive "traits".
- First, it depends on position. As Part 1 explained, voltage to ground changes module by module along a string. So PID losses are not uniform; they concentrate at one end of the string, which for p-type modules in a floating system is the negative end.
- Second, it depends on time. PID accumulates. It usually appears gradually, months to years after commissioning, and progresses faster in hot, humid seasons; it does not drop off suddenly one day.
- Third, it is worse in low light. This is a PID-s trait: shunt leakage weighs more heavily in weak light, so the shortfall in morning, evening and cloudy-day yields is especially obvious.
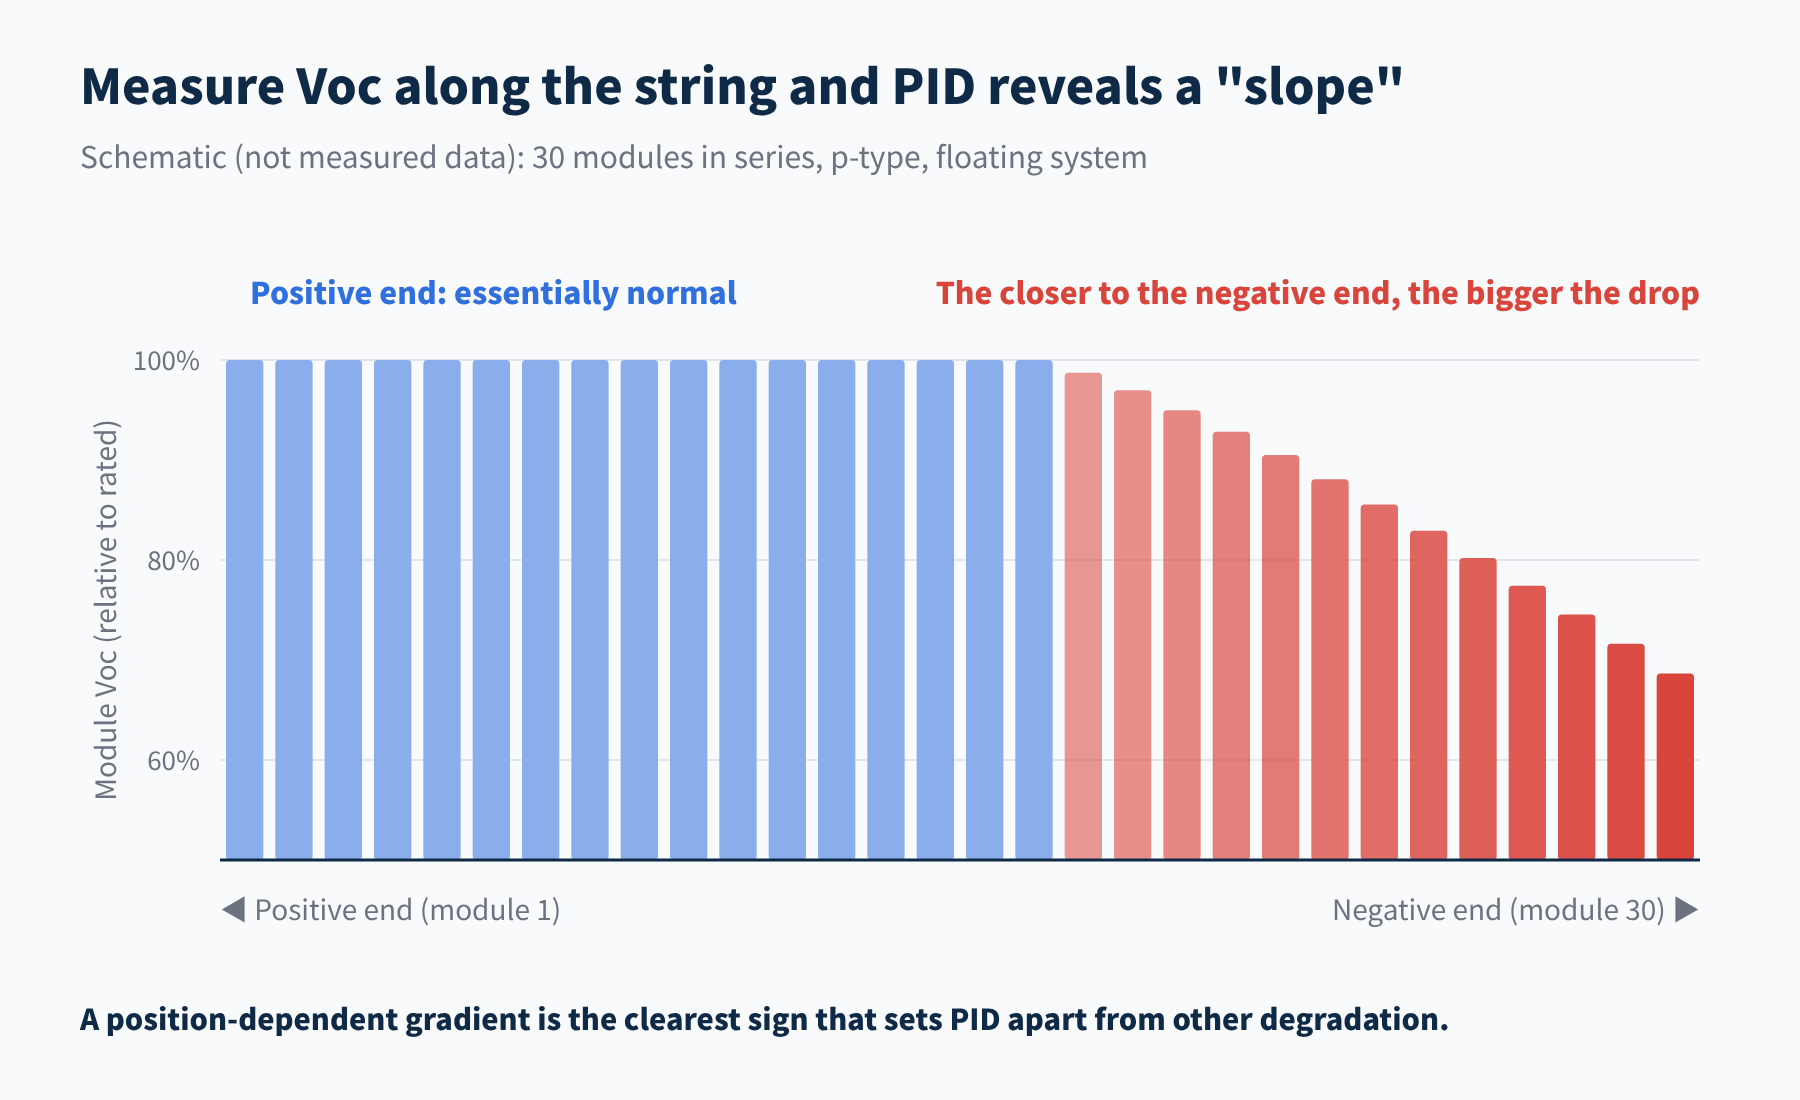
Figure 1 Typical distribution of module open-circuit voltage in a PID-affected string (schematic)
The table below gives a first, rough screen:
| Field observation | More like PID | More like something else |
|---|---|---|
| Distribution of losses | Concentrated at one end, graded along the string | Uniform across the plant: initial LID, etc. |
| Thermal image | Many warm cells in a "patchwork" | Single hot spot: shading, cracks, poor soldering |
| Module voltage | Falls gradually along the string | Whole module down about a third: bypass diode |
| When it appears | Months to years, worsening gradually | Suddenly: faults, shading, soiling |
02A four-step check, from coarse to fine
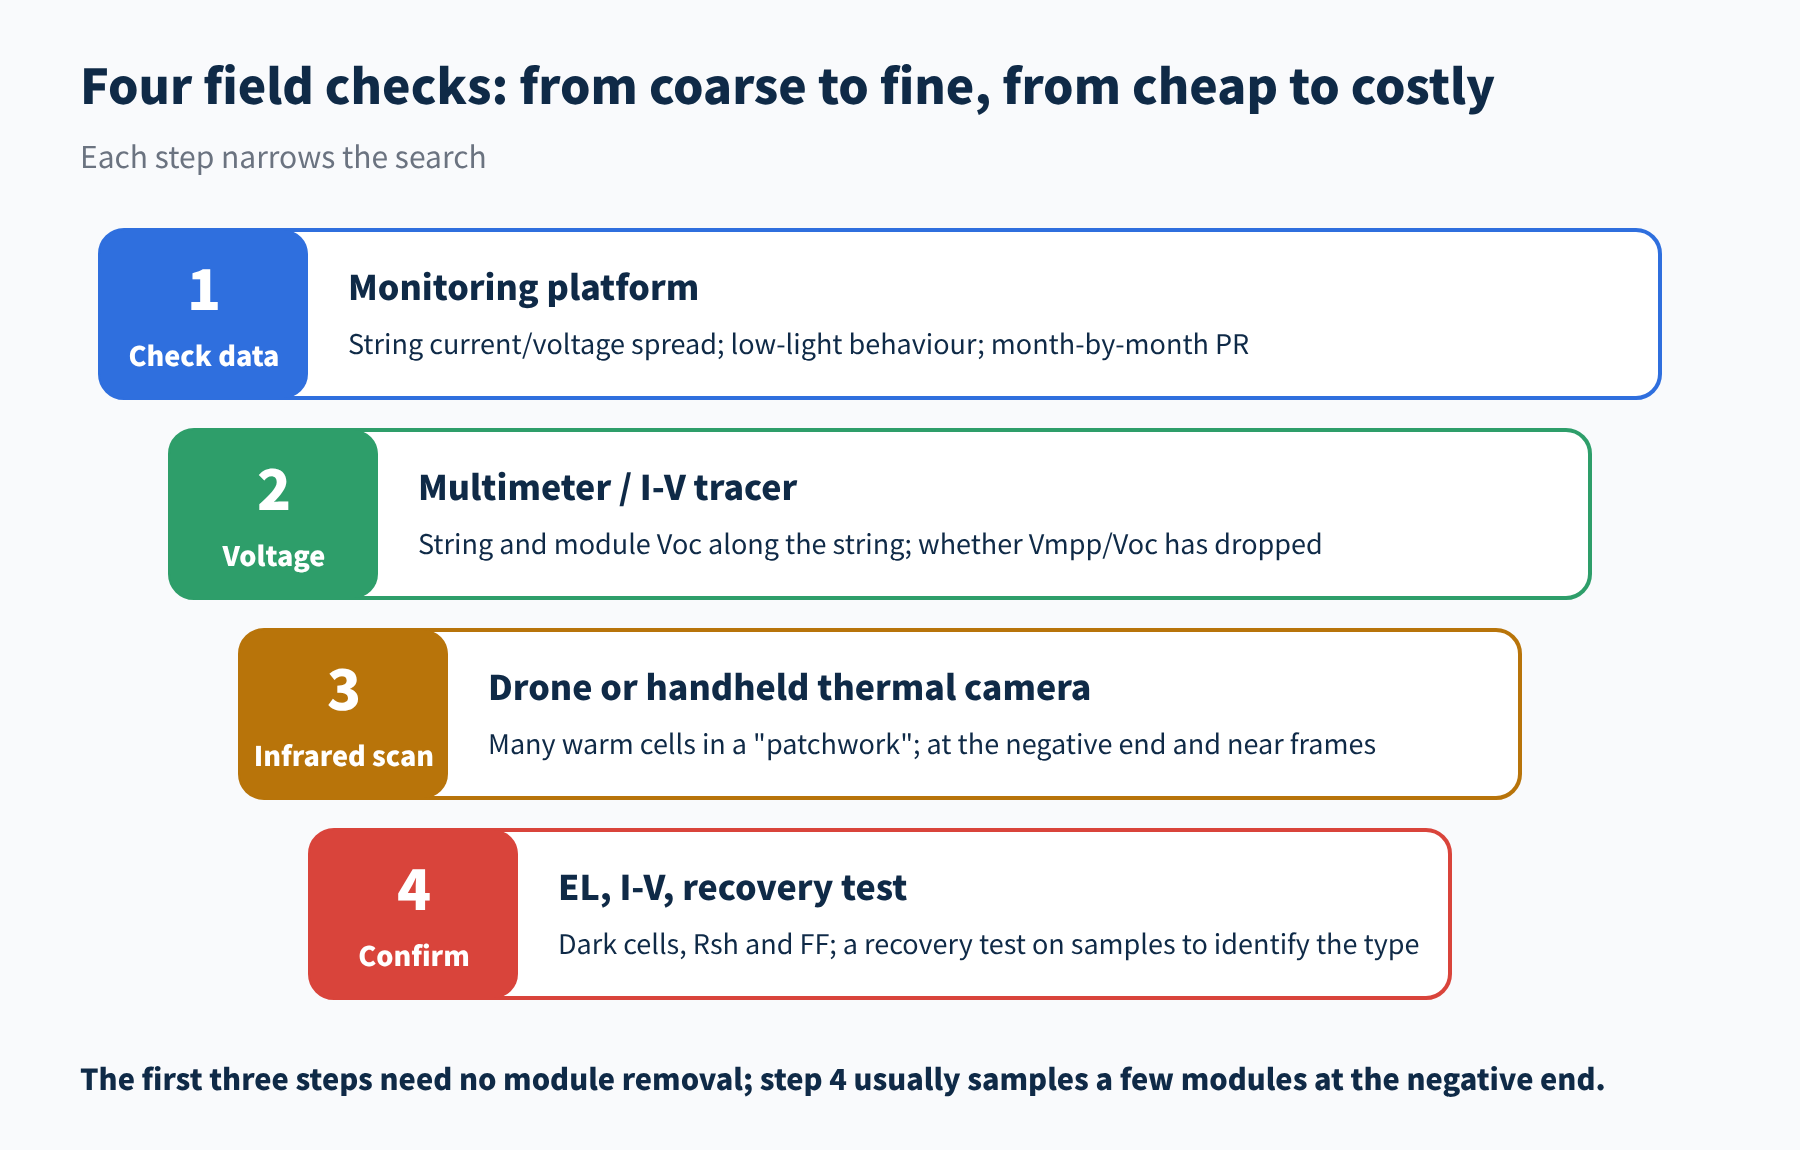
Figure 2 Four steps for investigating PID in the field
- Step 1: check the data. You can do this without leaving the office. Compare all strings on the same inverter: are some strings persistently low in current or power? Is the shortfall larger in the early morning and late afternoon? Is the performance ratio (PR) drifting down month by month?
- Step 2: measure voltage. On site, measure string open-circuit voltage, then measure each module's open-circuit voltage from the positive end to the negative end. A "slope" like the one in Figure 1 makes PID a strong suspect. Another indicator is the ratio of maximum-power-point voltage to open-circuit voltage, which falls below the datasheet value in PID-affected modules.
- Step 3: take infrared images. Scan the modules with a thermal camera while they are generating; large plants can use drones. PID shows a very recognisable thermal signature: many cells in one module run warm, in a patchwork or mosaic pattern, mostly at the negative end of the string and near the frame.
- Step 4: confirm. Take a few of the most suspect modules from the negative end for EL and I-V testing, then use the methods from Part 2 to identify the type: look at shunt resistance and FF, look at where cells go dark in the EL image, and run a recovery test if needed.
A 2022 study in Scientific Reports followed a 1.2 MW plant (polycrystalline modules) north of Barcelona, Spain. Because of a ground fault in the inverter, some strings were held at about −1000 V to ground for long periods, and PID appeared within 4–7 months of commissioning.
Drone infrared imaging showed affected modules at 55–60 °C, versus about 37 °C for healthy strings under the same conditions. On the same test segment, open-circuit voltage was 134.1 V for PID modules versus 183.6 V for healthy ones, and the performance ratio of affected strings fell by about 28%–40%.
All three signs, the positional pattern, the voltage drop and the infrared heating, were present in this case.
03Once PID is confirmed: how to recover
Before doing anything else, confirm the PID type and its sensitive polarity. Experience with p-type modules cannot be applied directly to n-type modules: get the polarity wrong and the "repair" becomes an accelerator.
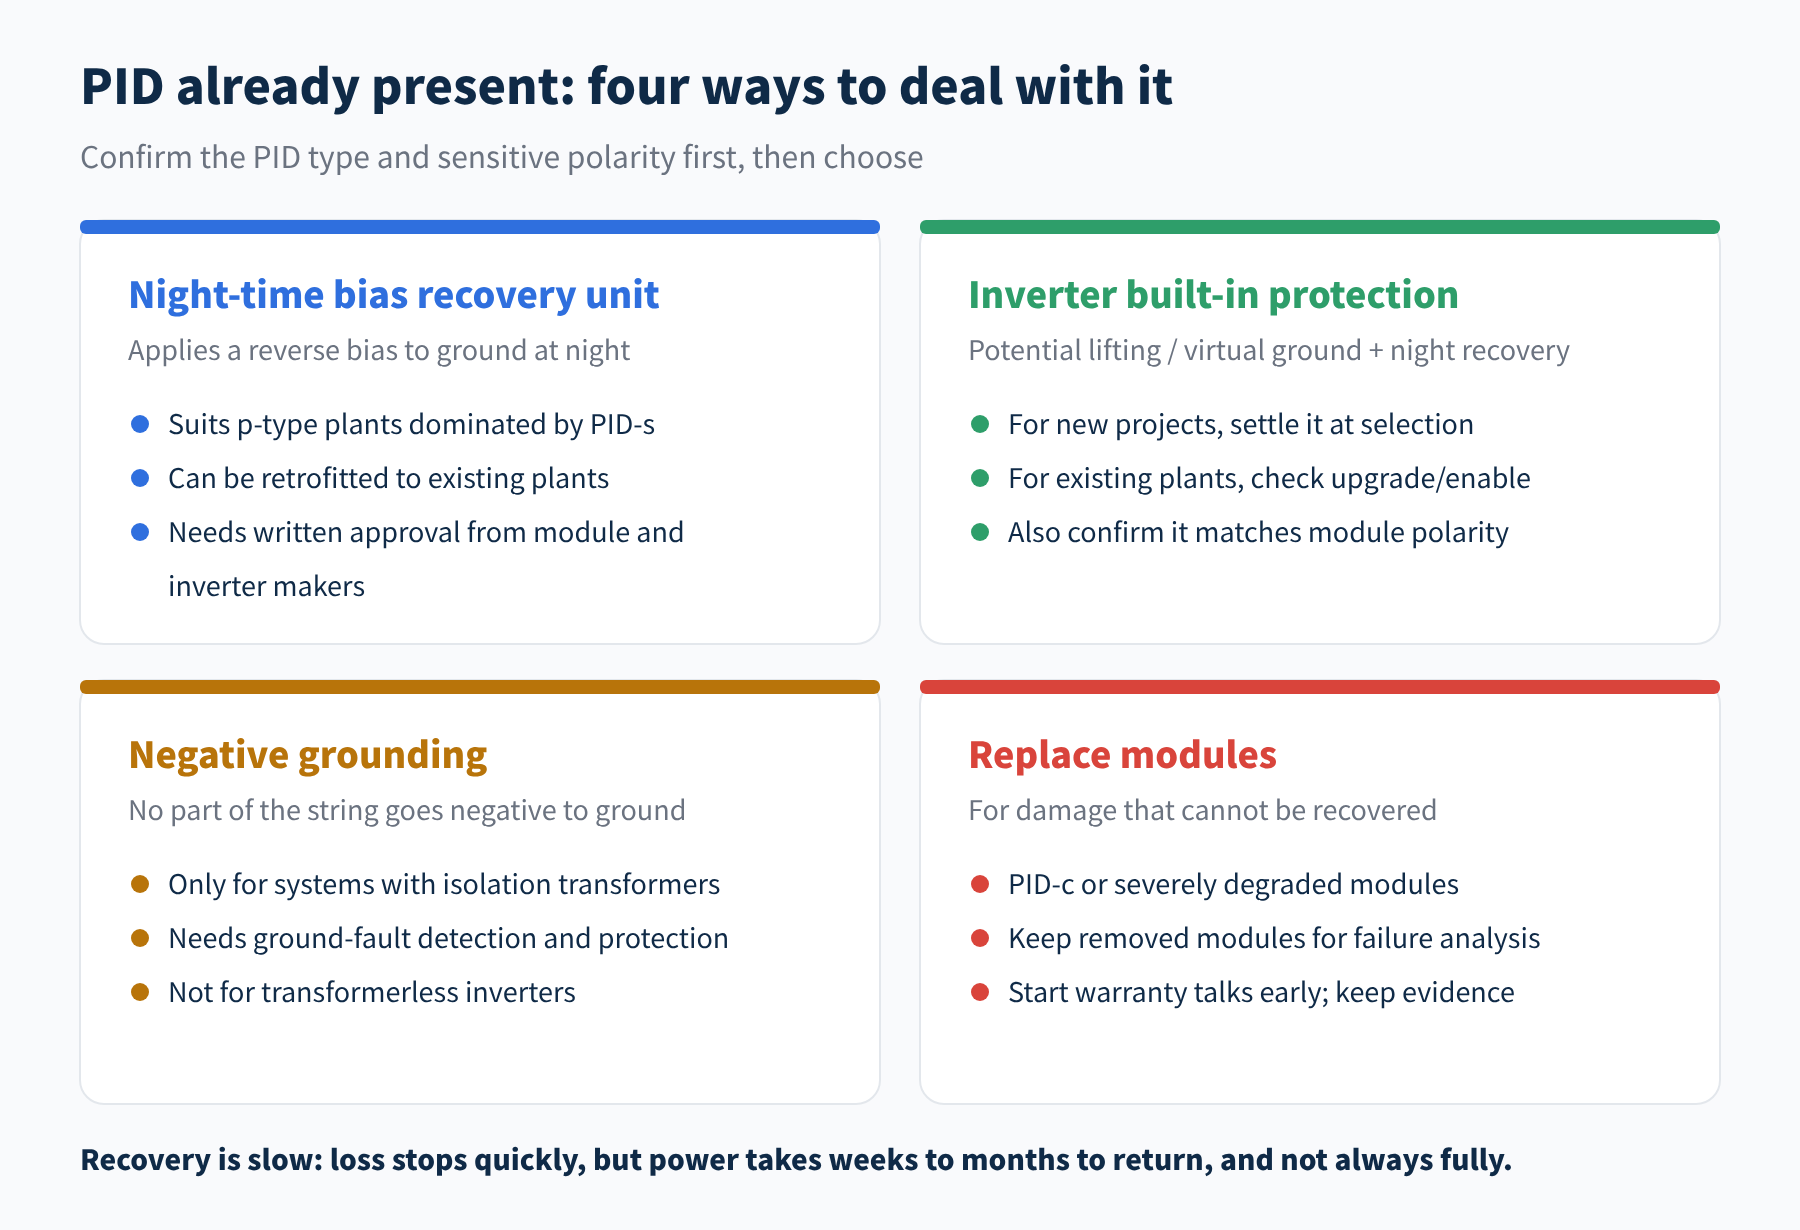
Figure 3 Four ways to deal with PID
- Night-time bias recovery units: the most common approach for existing p-type plants. The unit sits between the strings and the inverter; at night, when the modules are not generating, it raises the whole array to a high positive potential to ground (+400 V to +1,000 V for one manufacturer's device), driving the sodium ions that migrated during the day back out.
- Inverter built-in protection: the same principle, with the function integrated into the inverter, as covered in Part 1.
- Negative grounding: only suitable for systems with isolation transformers.
- Module replacement: the last resort, for PID-c and severe degradation.
Set realistic expectations for recovery
Once a recovery unit is installed, further degradation usually stops quickly, but power comes back much more slowly. One manufacturer's rule of thumb is that full recovery takes about half as long as the degradation did.
And recovery may not be complete. About a year after recovery units were fitted at the Spanish plant above, module surface temperatures had fallen by 9–13 °C and degradation had stopped, but the performance ratio stayed below 75% and showed no clear rebound. Stopping the loss is not the same as winning it back; the earlier you catch it, the more you can save.
① Have the module and inverter manufacturers approved the solution in writing, so the warranty is not affected?
② Does the applied voltage stay within the maximum rating of every system component?
③ Does the bias polarity match the modules' sensitive polarity?
04New projects: invest the effort up front
For plants not yet built, the most cost-effective approach is to put the "three lines of defence" from Part 3 into practice at every stage.
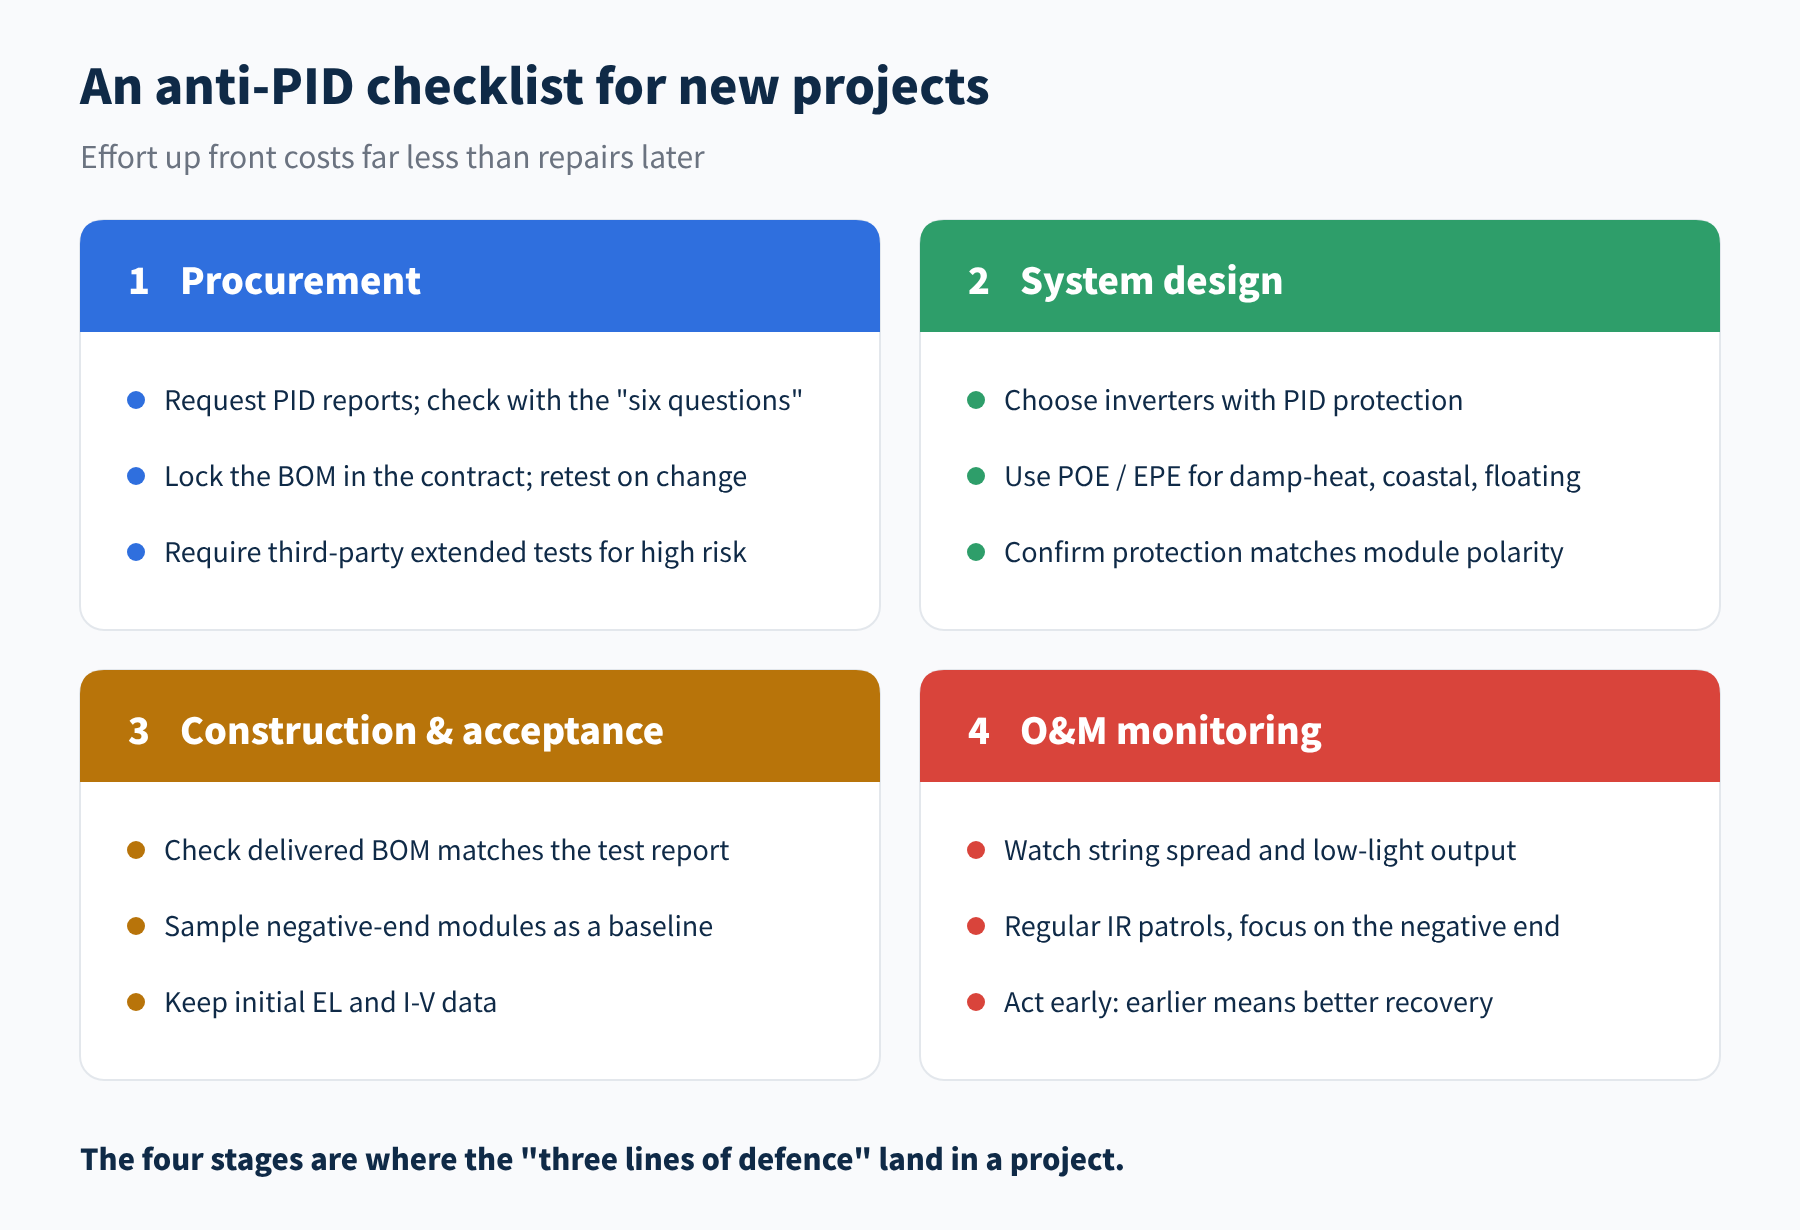
Figure 4 Anti-PID points at each stage of a new project
- Procurement: check PID test reports with the "six questions" from Part 4, and lock the BOM in the contract. Any change to the cells, encapsulant or glass should require new test data.
- System design: favour inverters with PID protection; for high-risk projects such as damp-heat, coastal and floating sites, do not economise on encapsulants.
- Construction and acceptance: check the BOM of delivered modules, and sample a batch of modules that will sit at the negative end to record initial EL and I-V data. This baseline is extremely useful later when judging whether, and by how much, modules have degraded.
- O&M monitoring: keep an eye on string spread and low-light performance as part of routine monitoring, and run regular infrared patrols with a focus on the negative end.
05Series recap
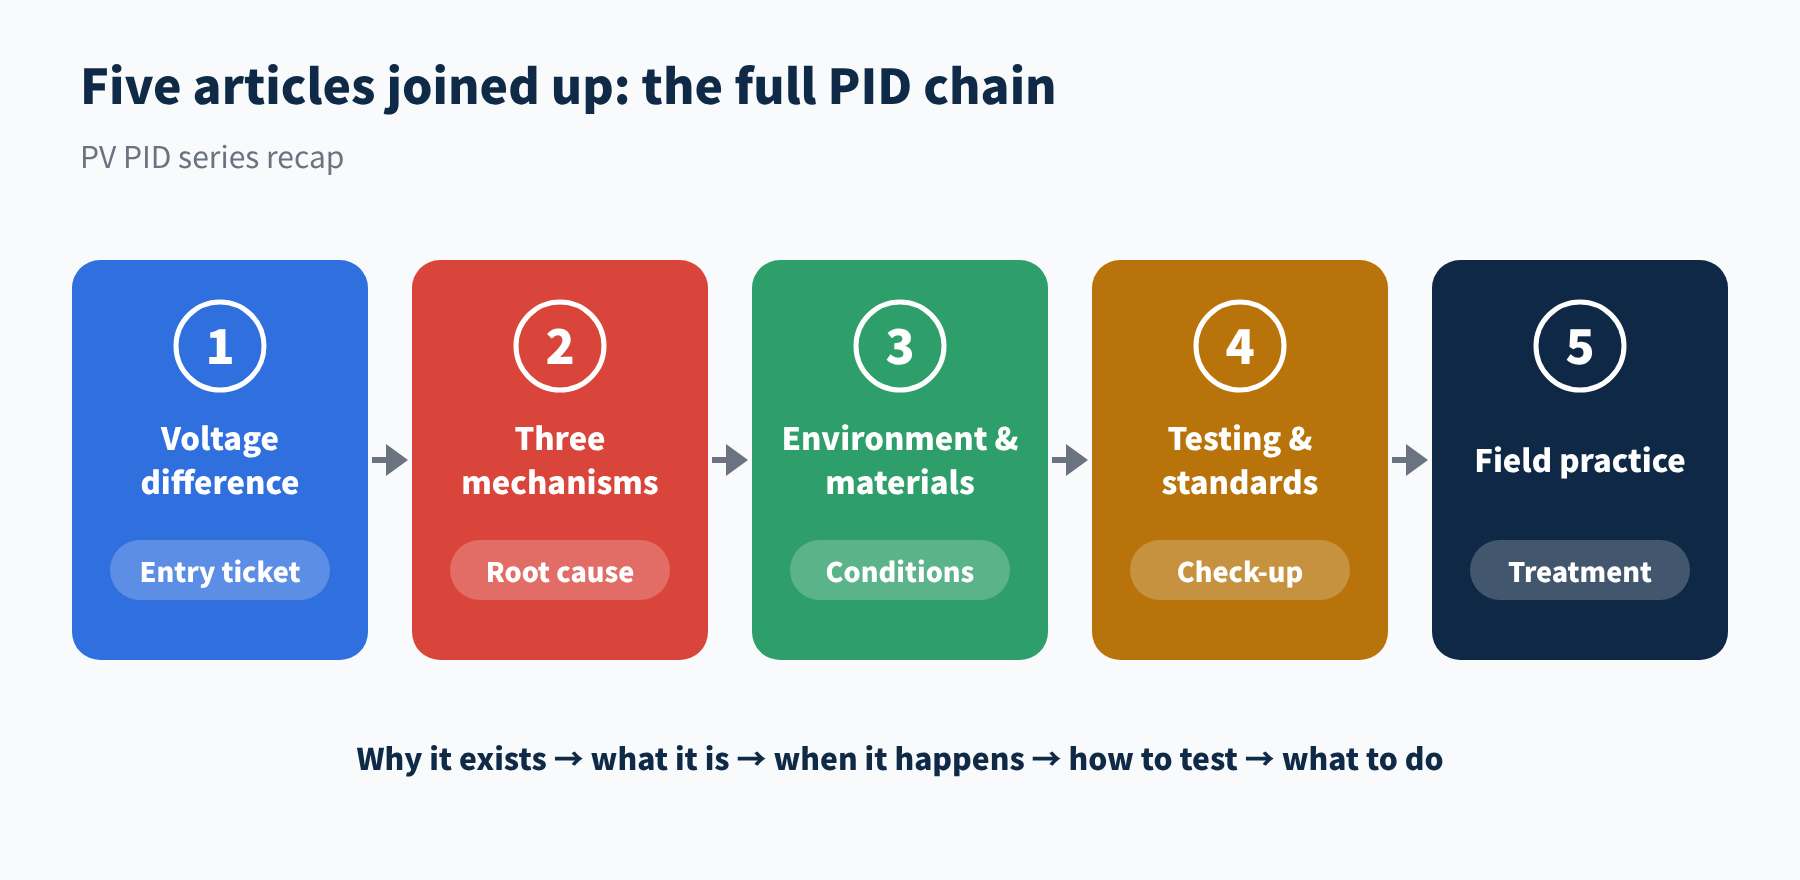
Figure 5 How the five articles of the PV PID series fit together
- ① Voltage difference: a high voltage difference is the necessary condition shared by all three types of PID; its size and polarity are set by the grounding scheme and module position.
- ② Mechanisms: PID-s is leakage, PID-p is passivation failure and PID-c is corrosion; their symptoms and reversibility differ.
- ③ Environment and materials: the voltage difference acts through leakage current, whose size is set by temperature, humidity, glass, encapsulant and cell coatings.
- ④ Testing: accelerated tests are screens, not predictions; when reading reports, check the standard, conditions, polarity, BOM, results and recovery step.
- ⑤ Field practice: investigate in the order data, voltage, infrared, confirmation; identify the type before choosing a remedy; prevention is always cheaper than repair.
06Final thoughts
PID is not mysterious. It is the result of voltage, environment and materials acting together over time, and every link in that chain offers a point of control. We hope these five articles help you feel more confident the next time you see a yield curve heading down.
Check position, measure voltage, take infrared images, then confirm; identify the type and polarity before choosing a remedy. Stopping the loss is not winning it back, and prevention is always cheaper than repair.
That concludes the PV PID series (5 parts). Thank you for reading all the way through. If you have run into PID in the field, we would be glad to hear from you.
References
- G. Badran, M. Dhimish. Field study on the severity of photovoltaic potential induced degradation. Scientific Reports 12, 22094 (2022): nature.com
- W. Luo, et al. Potential-induced degradation in photovoltaic modules: a critical review. Energy & Environmental Science 10, 43–68 (2017)
- IEC TS 62804-1:2025, Photovoltaic (PV) modules – Test methods for the detection of potential-induced degradation – Part 1: Crystalline silicon
- Kiwa PVEL, 2026 PV Module Reliability Scorecard – PID: scorecard.pvel.com/pid
A PV R&D and technology team with 10+ years of experience | In-depth technical knowledge sharing
Materials · Reliability · Failure Analysis · Standards & Certification · Products · Processes
Exploring AI + PV; collaboration welcome
Disclaimer:
1. Original content reflects the authors' personal views only, is for reference only and does not constitute investment advice.
2. Reposted and cited content is credited to its source, out of respect for original work.
3. Some content was produced with AI assistance (chart generation, data retrieval, concept explanations, etc.); the core framework and key content were written by our technical team and reviewed by people.
4. If anything is inaccurate or infringes your rights, please leave a message or contact us and we will deal with it.