
The TC200 Thermal Cycling Test for PV Modules: Test Conditions, Failure Signatures and Failure Mechanisms
Heat a module from −40 °C to +85 °C, cool it back down, and repeat 200 times. Glass, encapsulant, cells and ribbons each expand and contract by different amounts, pulling against one another. TC200 asks just one question: can this module's "skeleton" take that kind of punishment?
TC200 (thermal cycling, 200 cycles), like DH1000 (damp heat), is one of the most classic and fundamental environmental tests in PV module type approval and reliability assessment. The test method is defined in IEC 61215-2 as MQT 11 (Thermal cycling test).
Its core purpose is to determine the module's ability to withstand thermal mismatch, fatigue and other stresses caused by repeated changes in temperature. Put more plainly, it examines the interlayer shear forces and fatigue damage that arise because glass, encapsulant, cells and ribbons have mismatched coefficients of thermal expansion (CTE).
This article goes in order: how the test is run → what it challenges → how modules fail and why.
01TC200 test conditions
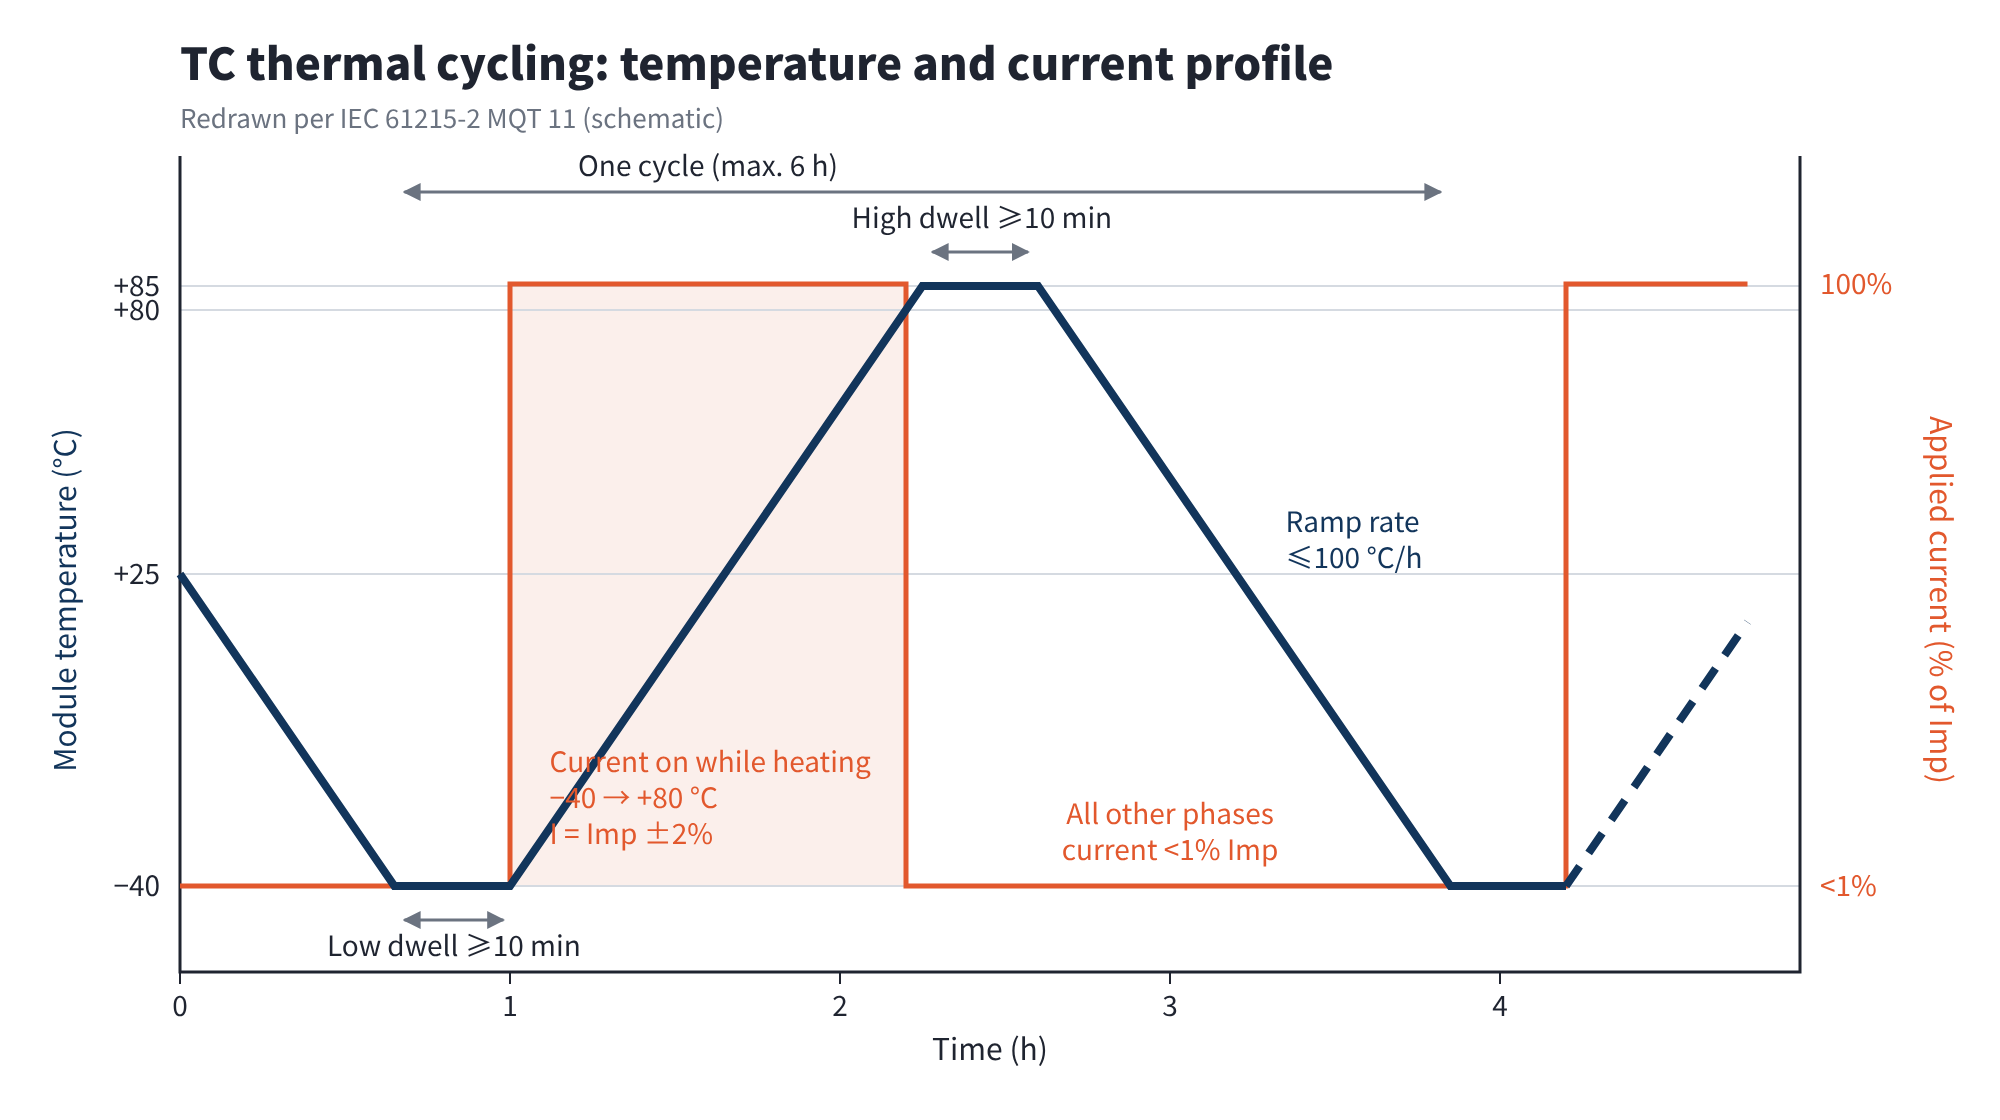
Figure 1 Temperature and current profile of TC thermal cycling (redrawn per IEC 61215-2 MQT 11, schematic)
Key parameters
- Temperature range: low −40 °C ± 2 °C, high +85 °C ± 2 °C;
- Number of cycles: 200 (in the MQT sequences, TC50 is also used as preconditioning before humidity freeze);
- Ramp rate: no more than 100 °C/h between the high and low temperatures;
- Dwell at the extremes: at least 10 min stable at both −40 °C and +85 °C;
- Cycle duration: no more than 6 h; from the maximum ramp rate and minimum dwell, the theoretical minimum is about 2.8 h;
- Current injection: while the module heats from −40 °C to +80 °C, a forward current equal to the peak-power current Imp (±2%; bifacial modules must include the rear-side gain) is applied; during cool-down, the −40 °C dwell and above 80 °C, the current is reduced to below 1% of Imp (see Figure 1);
- Junction-box weight: a 5 N weight hangs from the junction-box leads to simulate the long-term pull of the cables on the junction box.
Many people overlook the current. Energising the module during heating is not an optional extra: as current flows through solder joints and junction-box terminals it generates Joule heat, and the poorer the contact, the more heat it generates, so already-weak interconnects are exposed faster.
Pass criteria
- Visual: no major visual defects, such as obvious encapsulant delamination, backsheet cracking, broken ribbons or extensive cell breakage;
- In-test monitoring: no interruption of current flow during the test;
- Safety: insulation and wet leakage current tests passed;
- Power loss: ≤ 5% (judged on the final power at the end of the test sequence).
02What TC200 tests
If DH testing challenges a module's "electrochemical corrosion resistance" and "moisture barrier", TC testing challenges its resistance to thermo-mechanical fatigue and the bonding stability of its multi-material interfaces.
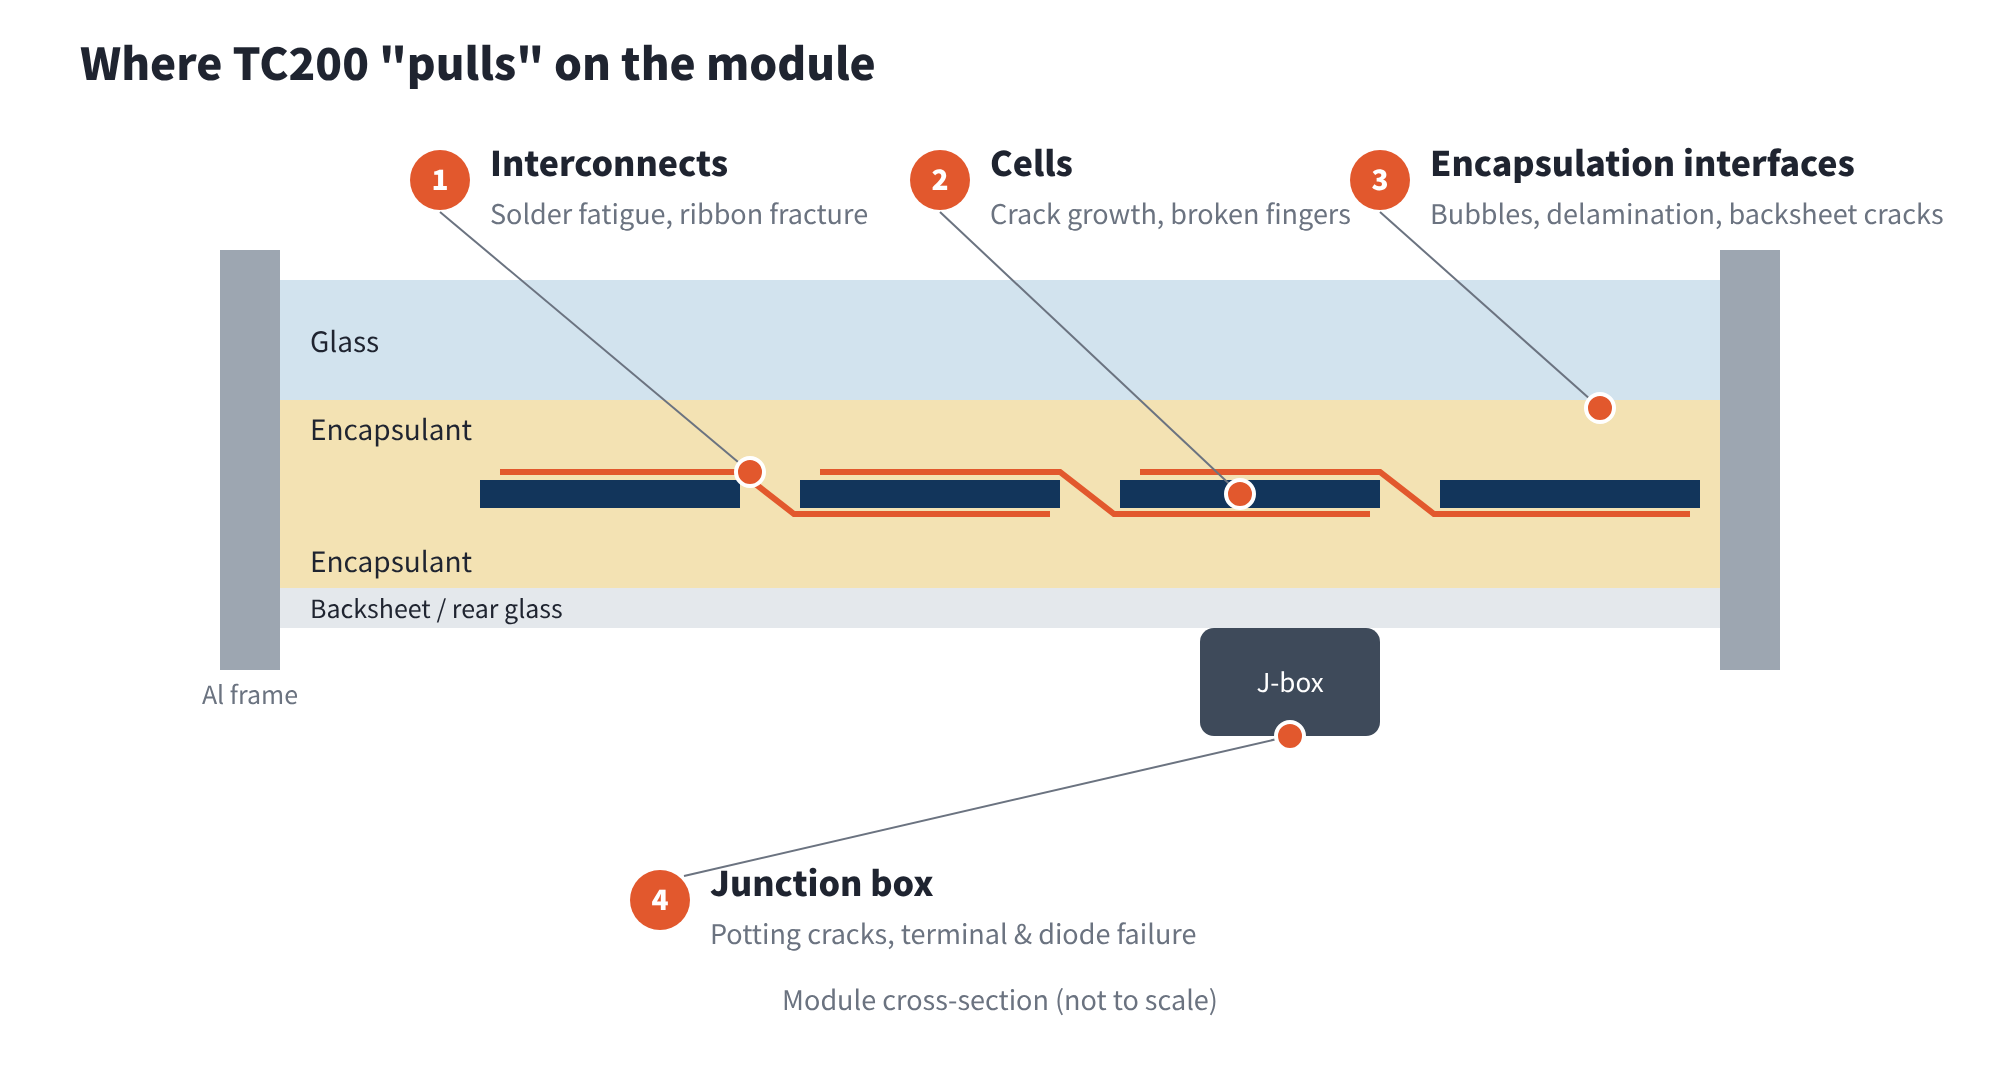
Figure 2 The four areas TC200 mainly tests
1. Fatigue life of the electrical interconnects
- Solder layer: whether the solder alloy can keep absorbing shear strain through hot–cold cycling without grain coarsening and fatigue cracking;
- Fine fingers: whether the finer metallization fingers of n-type cells can withstand repeated micro-deformation without breaking.
2. Interfacial adhesion of the encapsulation system
- Interface adhesion: whether the encapsulant keeps enough adhesion to the glass, cells and backsheet after long-term hot–cold shocks. With insufficient adhesion, tiny bubbles appear first and then develop into large-area delamination.
3. Stress tolerance of the silicon wafer
- Cyclic stress: whether the wafer can withstand the cyclic tensile and compressive stress imposed by the expanding and contracting ribbon;
- Process damage: TC also effectively reveals whether production (especially laser cutting and soldering) has left microscopic mechanical damage. With a poor process, originally tiny microcracks are torn open again and again during TC, growing into through-cracks or even isolated areas that no longer generate power.
4. Physical integrity of the insulation and sealing system
- Junction box: whether the potting compound and base adhesive crack under thermal stress;
- Frame sealant: whether the sealant between the aluminium frame and the glass loosens or ages;
- Backsheet: whether the backsheet of glass-backsheet modules becomes brittle and cracks at low temperature.
03The root cause of failure: CTE mismatch
Every TC failure ultimately comes from the same fact: a module is a laminate of materials whose coefficients of thermal expansion differ enormously.
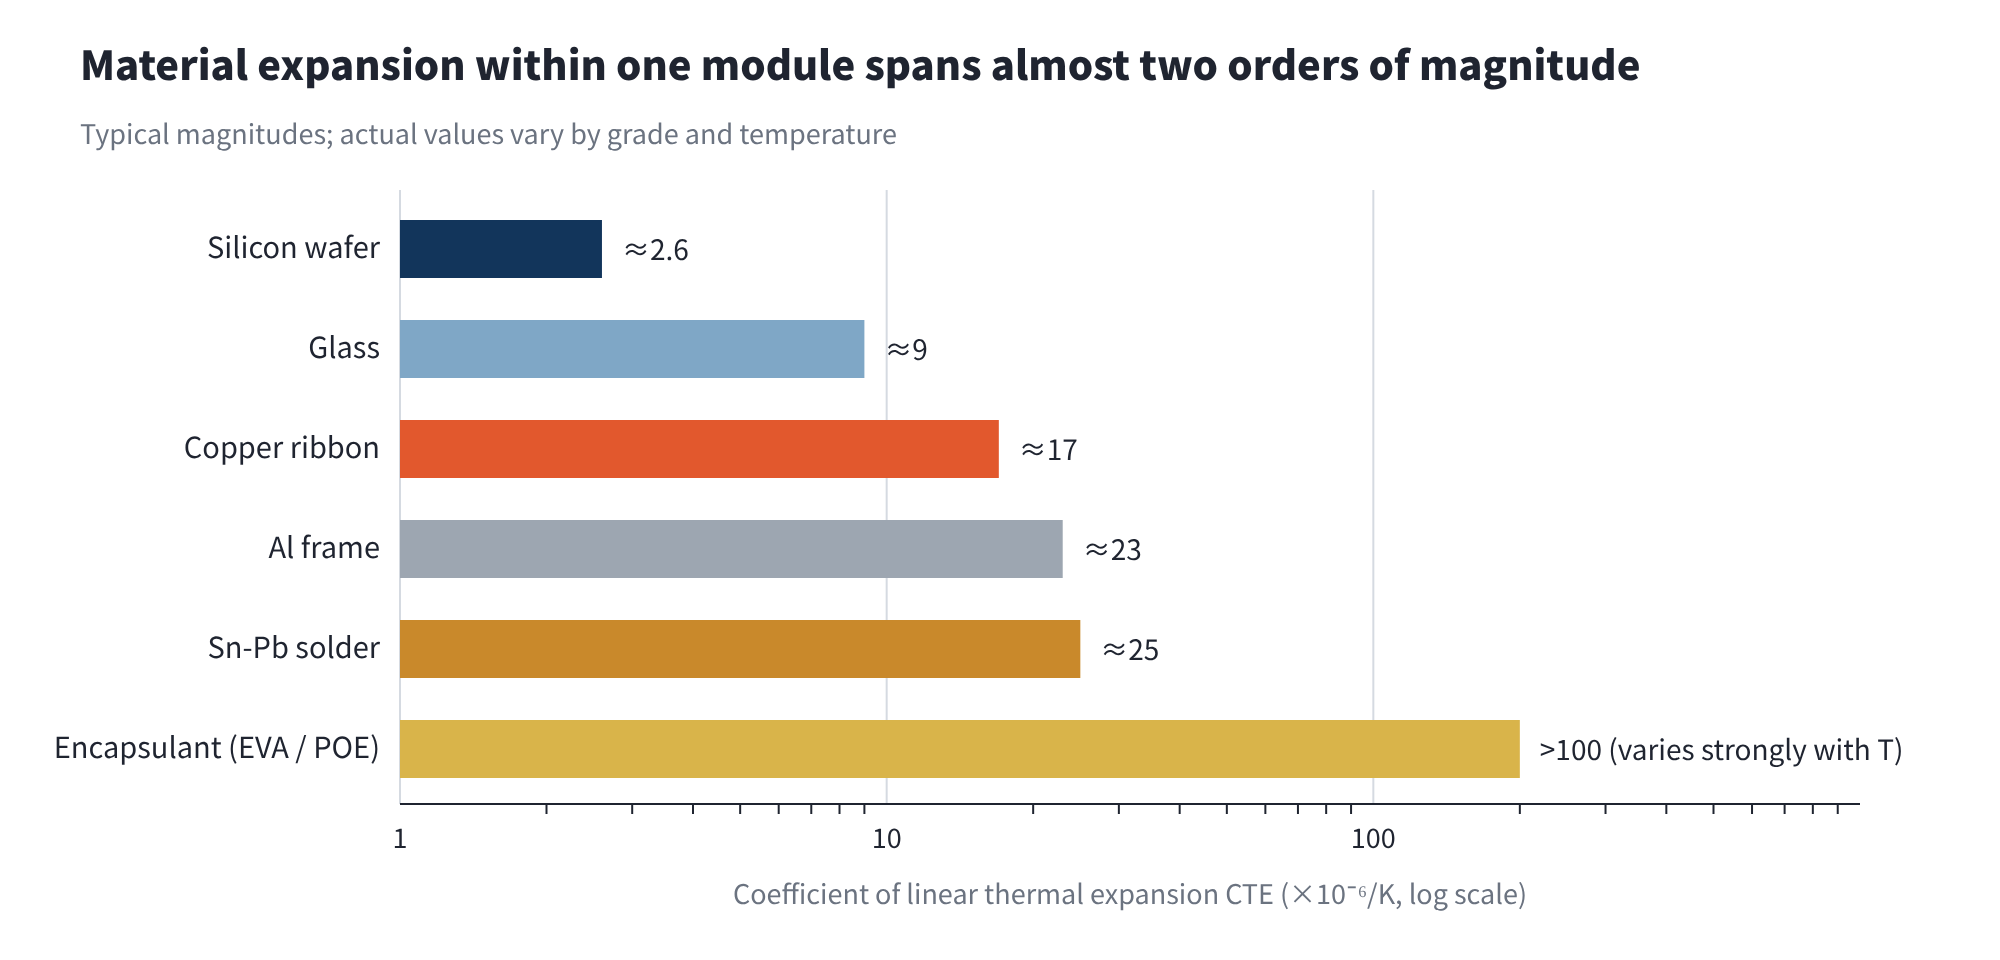
Figure 3 Linear thermal expansion coefficients of the main module materials (typical magnitudes)
The CTE of copper ribbon (about 17×10⁻⁶/K) is more than six times that of silicon (about 2.6×10⁻⁶/K), and polymer encapsulants exceed 100×10⁻⁶/K. Across the 125 K span from −40 °C to +85 °C, the layers "slip" relative to each other once per cycle. Two hundred cycles means two hundred fatigue loadings.
For a 182 mm long cell, the difference in length change between copper ribbon and silicon over 125 K is about 182 mm × (17 − 2.6)×10⁻⁶/K × 125 K ≈ 0.33 mm, while the solder layer that must absorb this mismatch is only 10–25 μm thick.
04TC200 failure signatures and mechanisms
1. Interconnect and metallization failure (the dominant failure mode)
The continuity of the module's internal circuit is very sensitive to repeated hot–cold shocks. The large difference in deformation between copper ribbon and silicon is absorbed mainly by the solder alloy layer in between, which is usually only 10–25 μm thick.
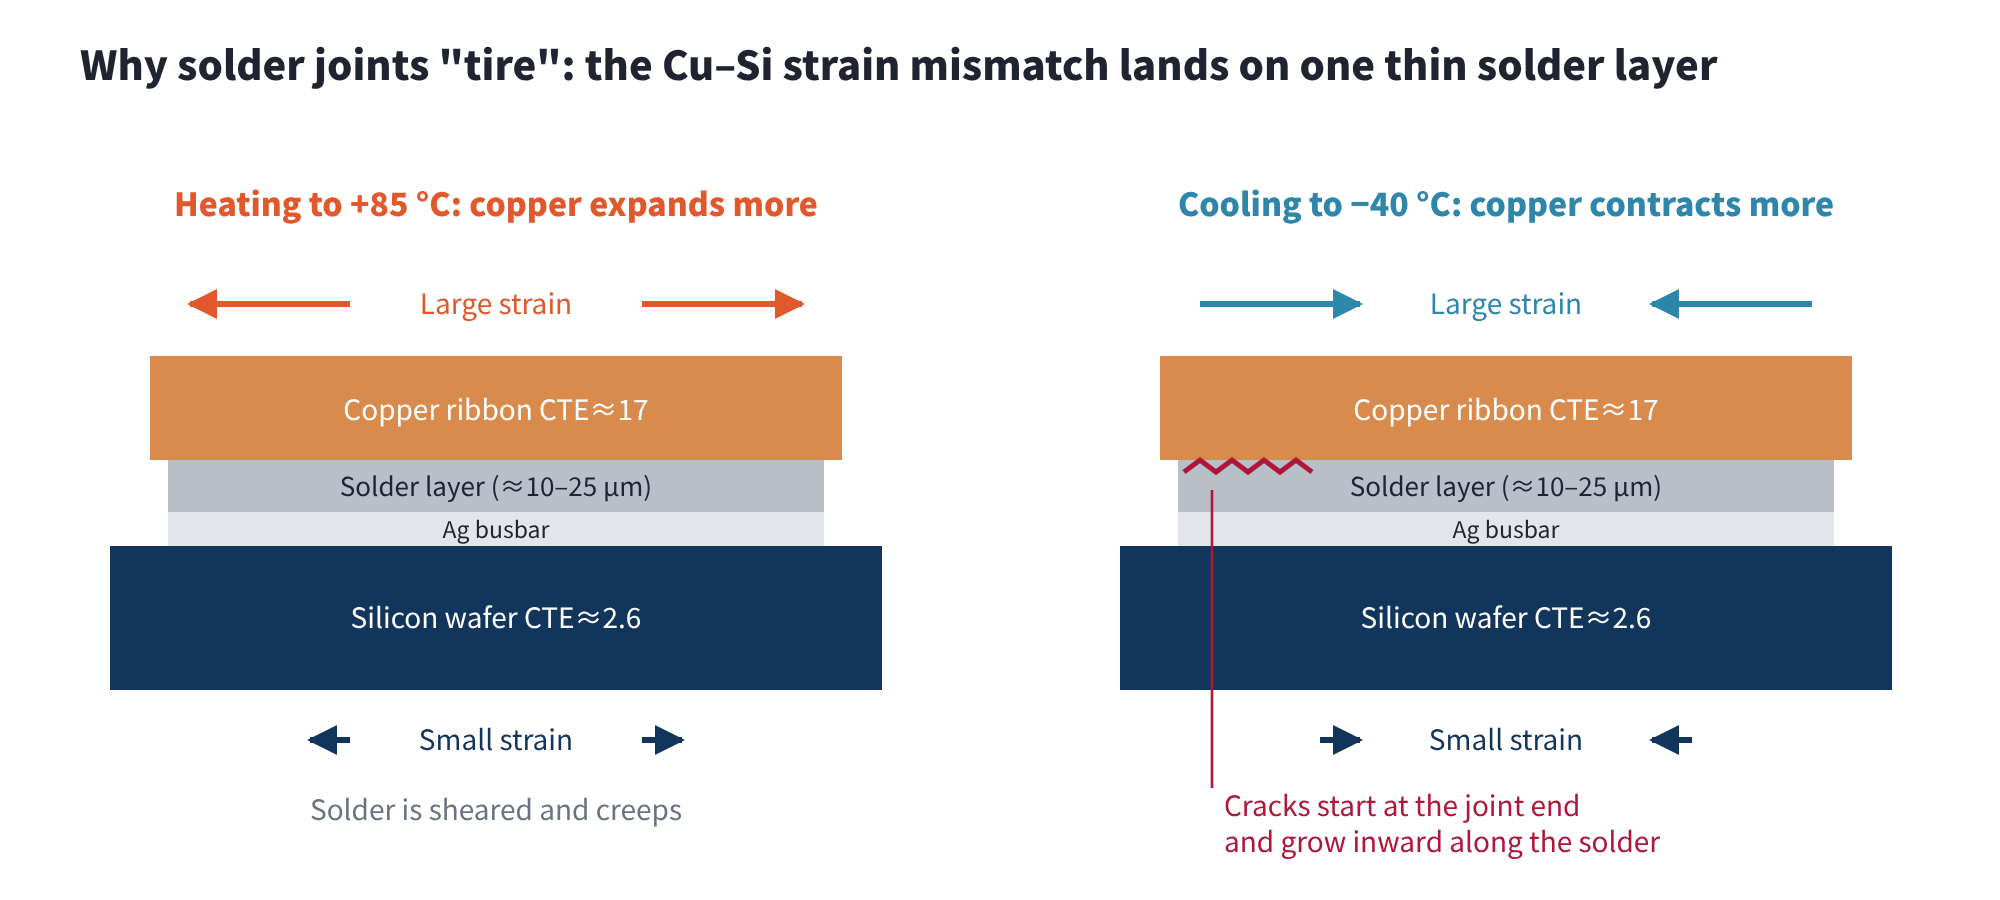
Figure 4 The deformation mismatch between copper ribbon and silicon concentrates on the solder layer (schematic)
Failure signatures
- Resistive parameters: Rs rises clearly and FF falls clearly;
- Other parameters: Rsh, Voc and Isc remain essentially unchanged;
- EL: dark bands and dark areas along the busbar direction, corresponding to cracked or high-resistance joints; in severe cases, parts of a cell or a whole string stop emitting;
- Visual: in severe cases, detached ribbons or ribbons separated from the cell are directly visible.
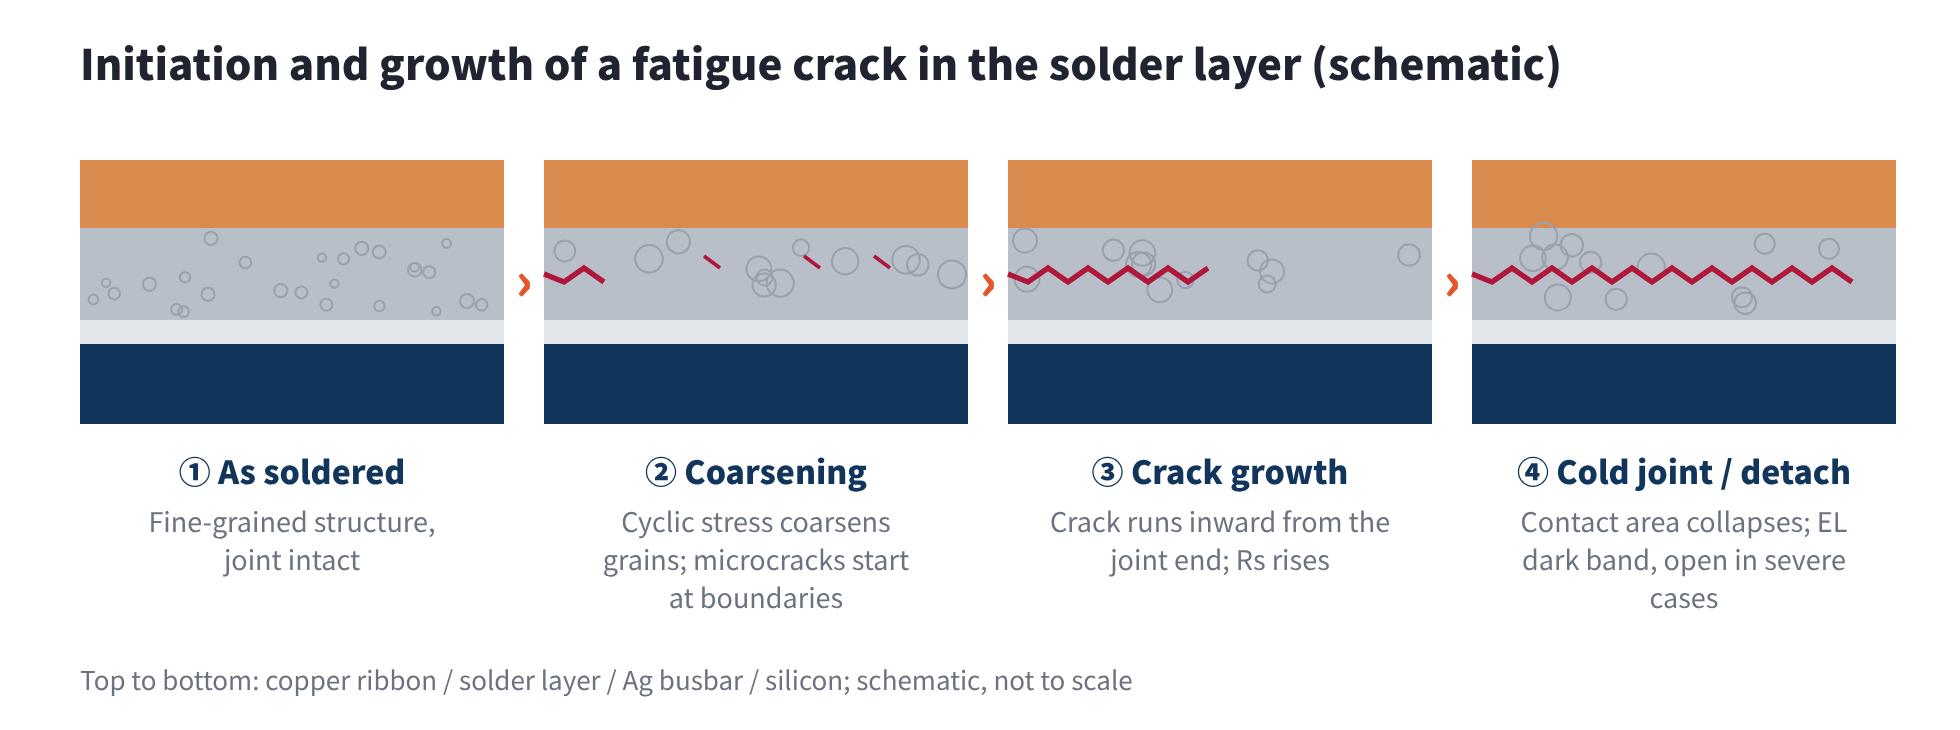
Figure 5 Initiation and growth of a fatigue crack in the solder layer (schematic)
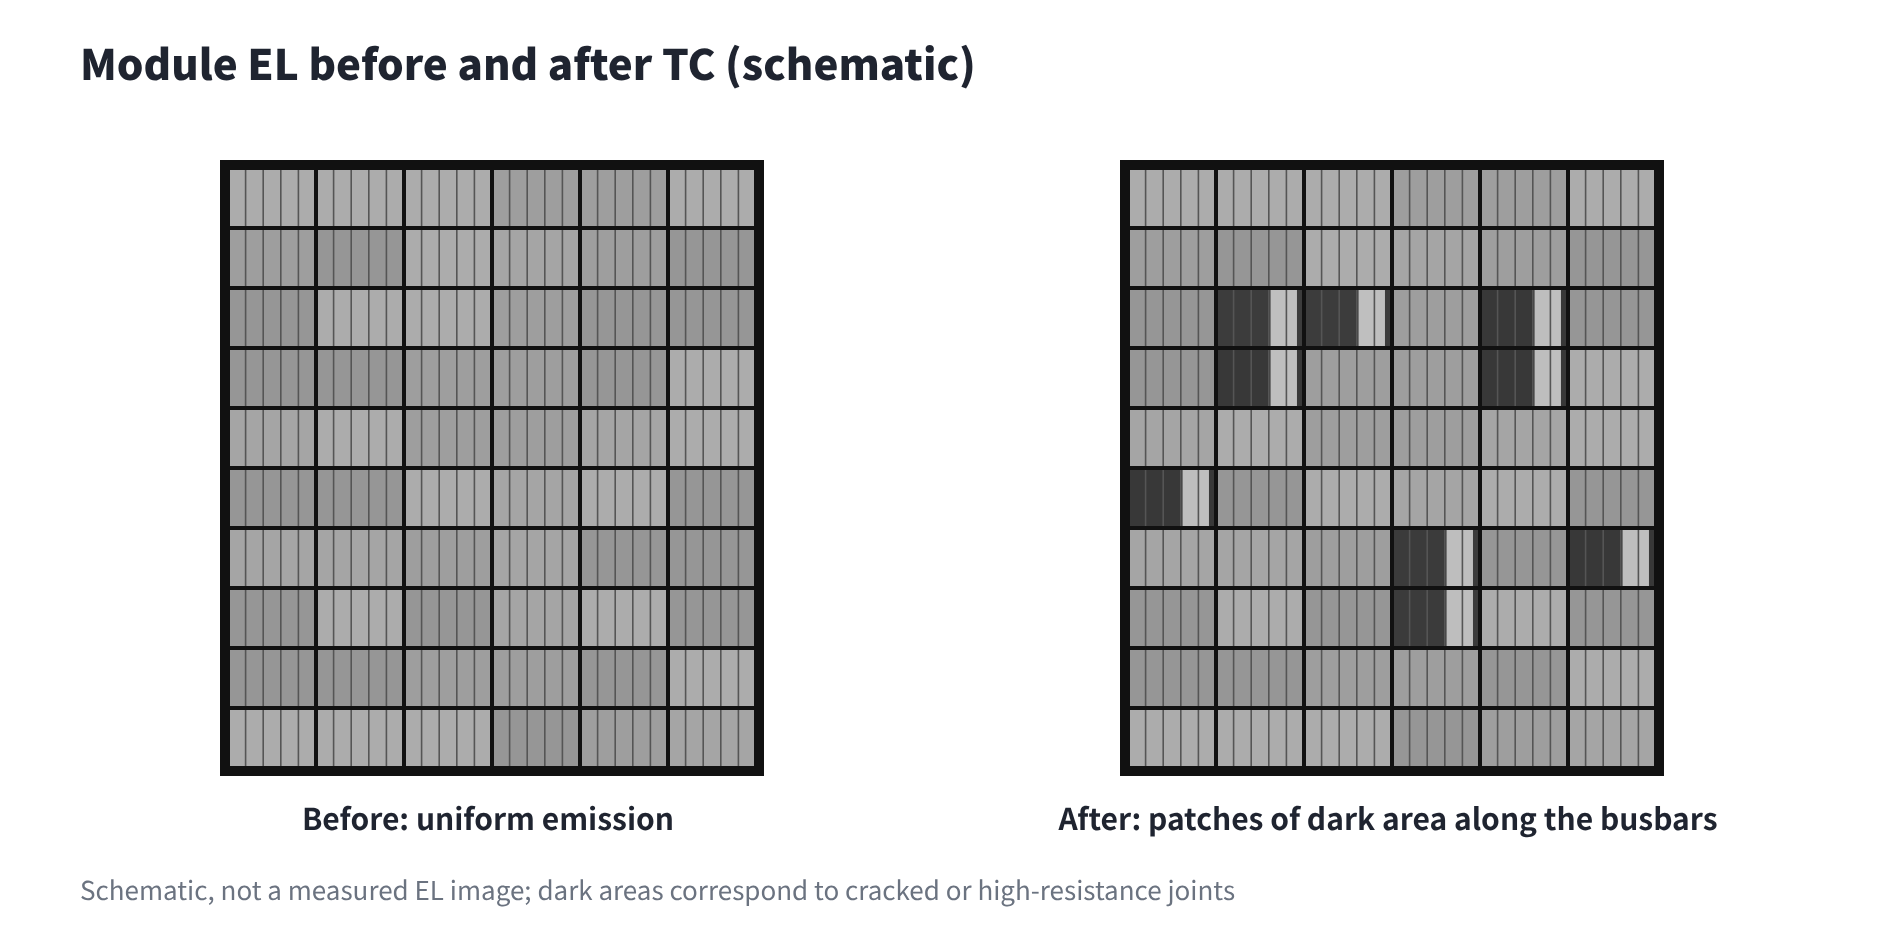
Figure 6 Module EL before and after TC: after testing, patches of dark area appear along the busbars (schematic)
Failure mechanisms
- Solder-joint fatigue: in conventional or low-temperature solders containing tin, lead and bismuth (e.g. Sn-Pb-Bi), repeated thermo-mechanical stress causes microstructural coarsening of the grains. Microcracks initiate at stress concentrations on grain boundaries, then grow along the solder layer under shear, finally producing cold joints or complete detachment.
- Ribbon fatigue fracture: the spacing between cells changes repeatedly with temperature, so the ribbon between cells (especially at the bend) is repeatedly stretched and flexed, accumulating plastic strain cycle after cycle. Once the accumulated damage exceeds the fatigue limit of the copper, the ribbon itself cracks and eventually breaks.
2. Cell-level failure
Cells such as n-type TOPCon have finer fingers and thinner wafers, so they are more sensitive to mechanical stress and thermal cycling is a tougher test for them.
Failure signatures
- Current: Isc falls, by an amount related to the area that has lost electrical connection;
- FF and resistance: FF falls, Rs rises slightly and Rsh may fall;
- Voltage: Voc remains essentially unchanged or drops slightly;
- EL: irregular line-shaped or tree-shaped dark lines; fragments isolated by cracks go completely dark.
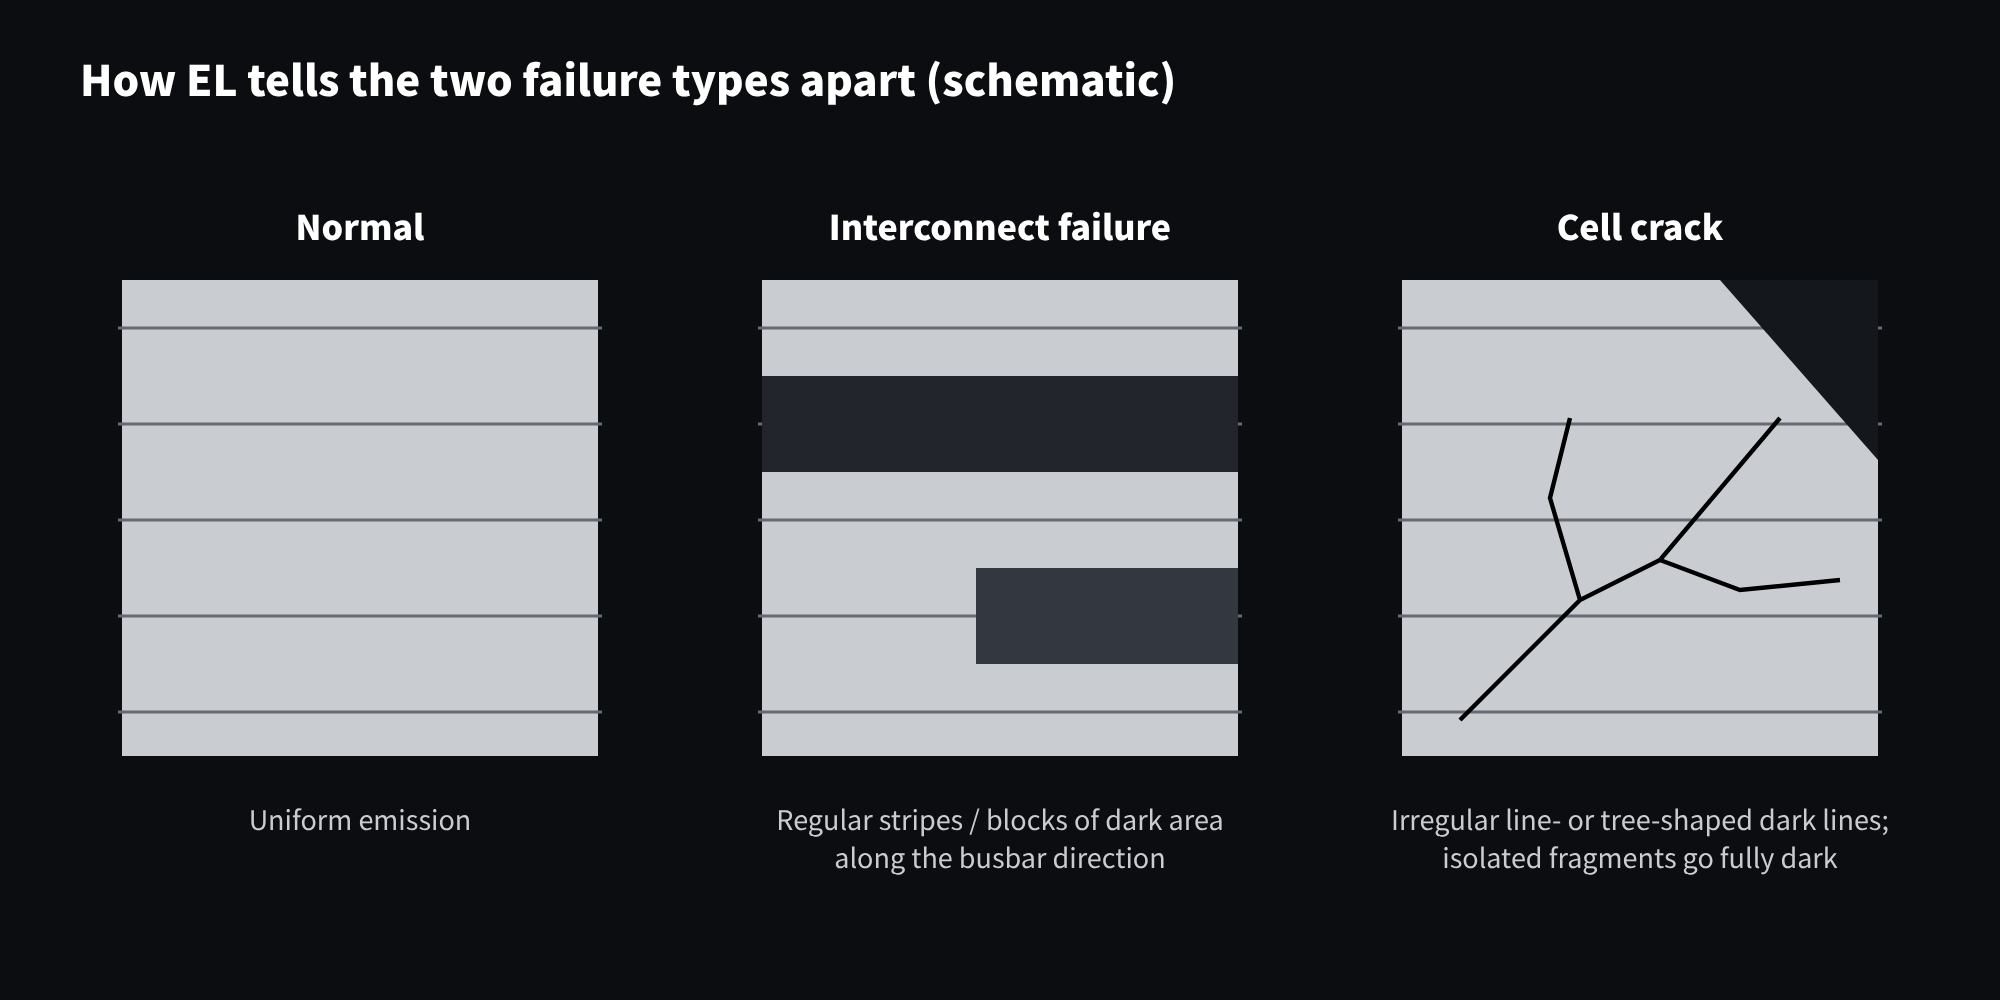
Figure 7 How interconnect failure and cell cracks differ in EL images (schematic)
Failure mechanism
As the ribbon expands and contracts, it imposes cyclic tensile and compressive stress on the wafer. When the stress concentrates at the wafer edge, at microscopic damage left by laser cutting, or at an existing tiny microcrack, the stress intensity factor at the crack tip exceeds the fracture toughness of silicon and the crack grows rapidly.
Put the first two failure types side by side and their electrical "fingerprints" are clearly different:
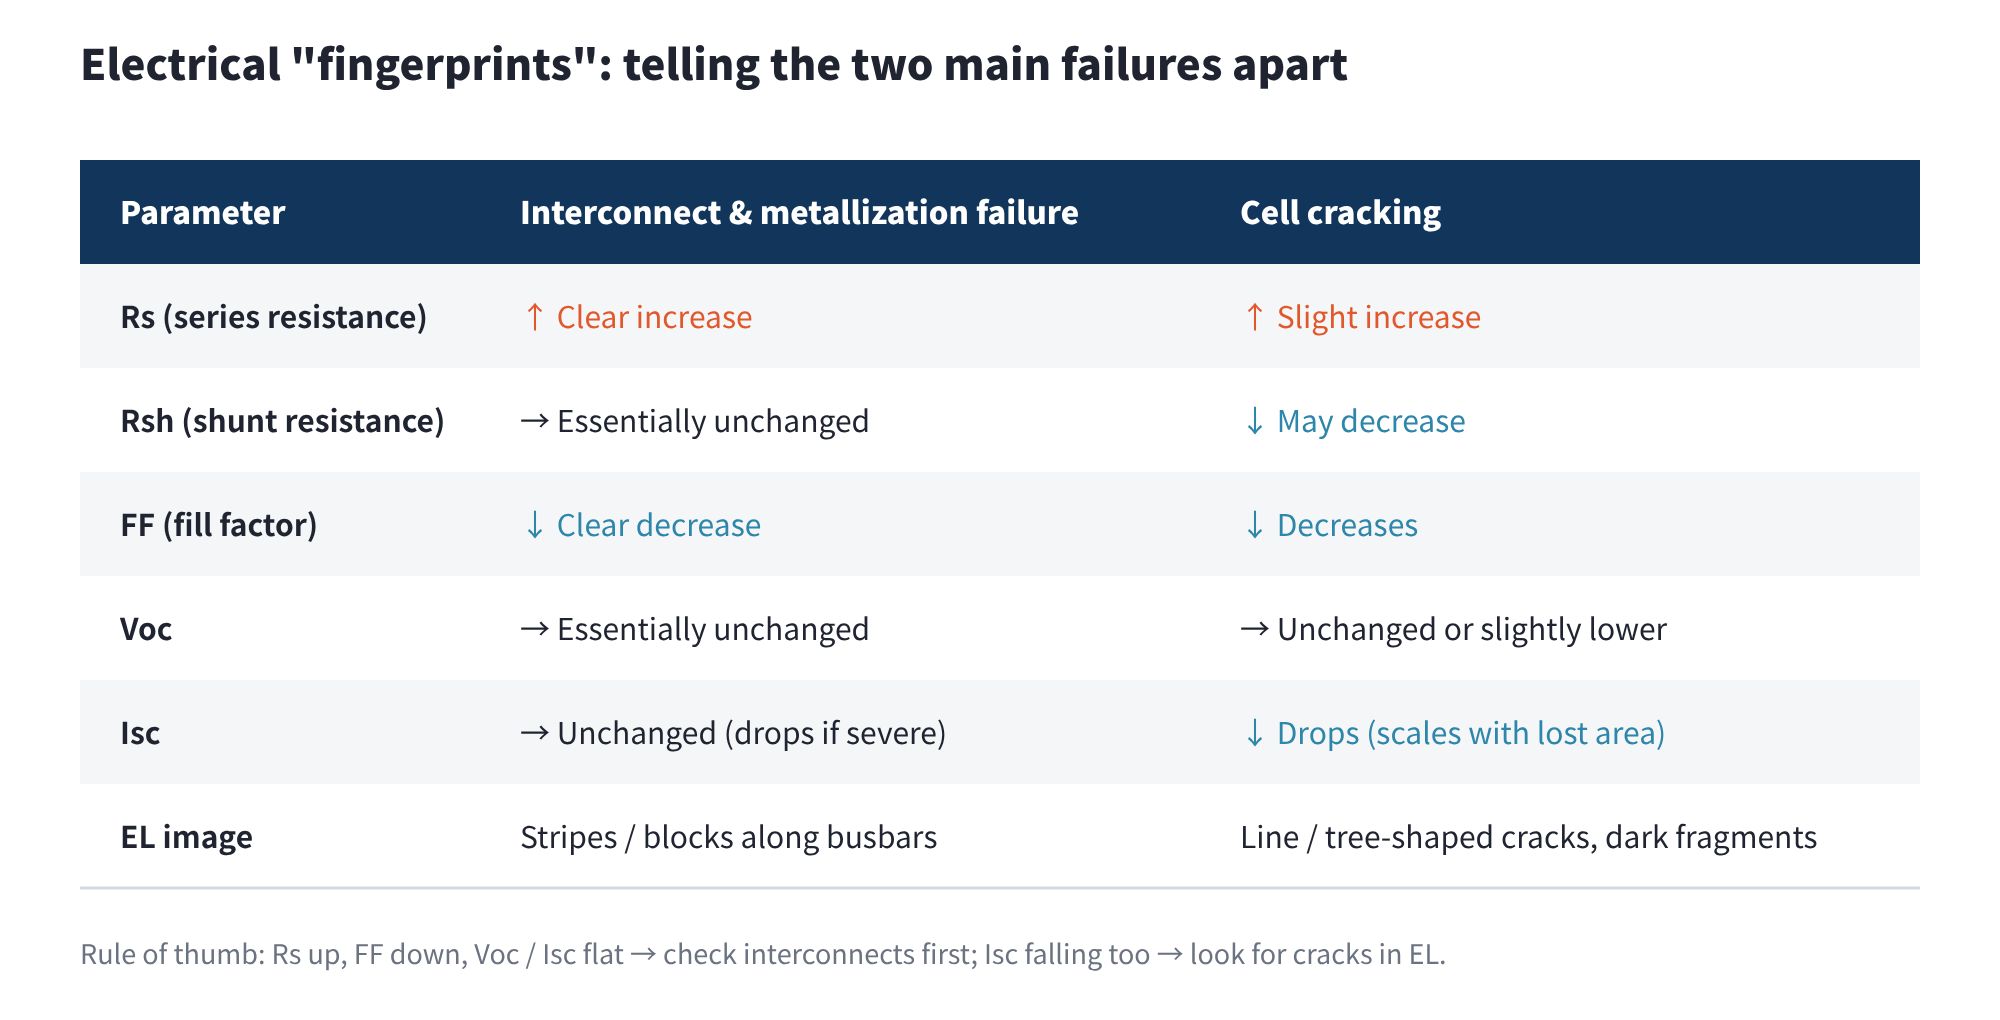
Figure 8 Electrical signatures of interconnect failure vs. cell cracking
3. Encapsulant failure
Polymer encapsulants such as EVA and POE have very high CTEs (> 100×10⁻⁶/K). In the module they provide adhesion, stress buffering, insulation and a moisture barrier, yet their own mechanical state changes dramatically with temperature.
Failure signatures
- Bubbles and delamination: bubbles or large-area delamination between encapsulant and glass, cells or backsheet, especially near the module edges;
- Surface cracks: fine cracks visible to the naked eye on the backsheet or encapsulant surface.
Failure mechanisms
- Hot phase: at +85 °C, the polymer softens and creeps, and interfacial adhesion drops;
- Cold phase: at −40 °C, the encapsulant stiffens, its modulus rises sharply and it loses its ability to buffer stress. Interfacial shear stress peaks at this point, the interface bond is destroyed and irreversible delamination forms.
4. Junction-box and bypass-diode failure
During heating, TC injects a current on the order of Imp, which flows through busbar solder joints, junction-box terminals, cables and connectors. These electrical connections therefore face a combined thermal load + electrical load.
Failure signatures
- Structure: junction-box potting cracks; the junction box detaches from the backsheet / glass;
- Connections: contact resistance rises and local overheating occurs at busbar-to-terminal solder or crimp joints;
- Devices: the bypass diode fails after testing.
Failure mechanisms
- Adhesive loosening: the silicone potting and base adhesive also lose adhesion through thermal expansion and contraction; combined with the 5 N weight, a weakly bonded junction box gradually works loose;
- Contact degradation: busbar-to-terminal connections are repeatedly stressed during cycling and gradually degrade; heat from contact resistance while current flows accelerates the degradation further;
- Diode: note that while forward current is injected, the bypass diode is reverse-biased and essentially does not conduct. Diode failures in TC come mainly from repeated thermal stress damaging its internal package, leads and soldered / clamped contacts; higher reverse leakage at high temperature also adds to its thermal load.
This is also why the industry increasingly supplements TC200 with extended tests such as TC400 and TC600. Kiwa PVEL's PQP, for example, notes that the standard TC200 can miss junction-box cable-termination issues that its extended TC600 testing has identified.
05Final thoughts
- TC200 is essentially a thermo-mechanical fatigue test: 200 cycles of −40 °C ⇄ +85 °C, with Imp current injected during heating.
- The root cause of failure is multi-material CTE mismatch, with stress concentrating on the thinnest and softest links.
- Interconnect and metallization failure is the most common; the typical signature is rising Rs and falling FF, with Voc and Isc essentially unchanged.
- Cell cracking typically shows as falling Isc and FF, with irregular dark lines and dark fragments in EL.
- Encapsulant delamination and junction-box failure show up mainly in visual inspection and safety performance.
When troubleshooting TC failures, look at the I–V parameter changes and EL images together: use the changes in Rs / FF / Isc to decide the direction, locate the problem with EL, and finally confirm the mechanism by cross-sectioning or SEM.
If you have seen other typical failure behaviour in TC testing, we would be glad to hear from you.
References
- IEC 61215-1:2021, Terrestrial photovoltaic (PV) modules – Design qualification and type approval – Part 1: Test requirements
- IEC 61215-2:2021, Terrestrial photovoltaic (PV) modules – Design qualification and type approval – Part 2: Test procedures (MQT 11 Thermal cycling test)
- Kiwa PVEL, PV Module Product Qualification Program (PQP): Thermal Cycling (TC600)
A PV R&D and technology team with 10+ years of experience | In-depth technical knowledge sharing
Materials · Reliability · Failure Analysis · Standards & Certification · Products · Processes
Exploring AI + PV; collaboration welcome
Disclaimer:
1. Original content reflects the authors' personal views only, is for reference only and does not constitute investment advice.
2. Reposted and cited content is credited to its source, out of respect for original work.
3. Some content was produced with AI assistance (chart generation, data retrieval, concept explanations, etc.); the core framework and key content were written by our technical team and reviewed by people.
4. If anything is inaccurate or infringes your rights, please leave a message or contact us and we will deal with it.