
5 % or 1 %? In Hot-Spot Testing, the Real Problem Is a Worst Case That Moves
Anyone who has run hot-spot tests has probably seen this: the same module passes cleanly at lab A and comes back from lab B with a burn mark. Look closer and the two labs picked shading ratios several points apart. No wonder many in the industry call the search for the worst-case shading ratio a black art — some insist on 1 % steps, others say 5 % is plenty. In this article we work the problem through with a simplified circuit model. The conclusion may not match intuition: step size is not the culprit; a worst case that moves is.
01 What the test really measures: a cell forced into the second quadrant
Cells in a module are connected in series. When one is shaded its photocurrent drops, but the rest of the string keeps pushing a large current through it. The shaded cell is forced into reverse bias — the second quadrant of the I-V curve (negative voltage, positive current) — and turns from generator into load, converting power produced by the other cells into local heat.
The hot-spot endurance test MQT 09 in IEC 61215-2:2021 shades the selected cells at the worst-case condition under about 1000 W/m² and a module temperature of 55 ± 15 °C, first for 1 hour, extended up to 5 hours if the temperature is still rising. Visual inspection, maximum power, insulation and wet leakage current are then checked.
Disagreement concentrates on that worst-case step. The standard offers an electrical (I-V curve) method and a thermal-imaging method for finding it, but leaves plenty of room in execution: how fine the steps are, which direction the tape runs, how long each step dwells — lab work instructions differ. PI Berlin's published procedure, for example, steps from 10 % to 100 % in 10 % increments.
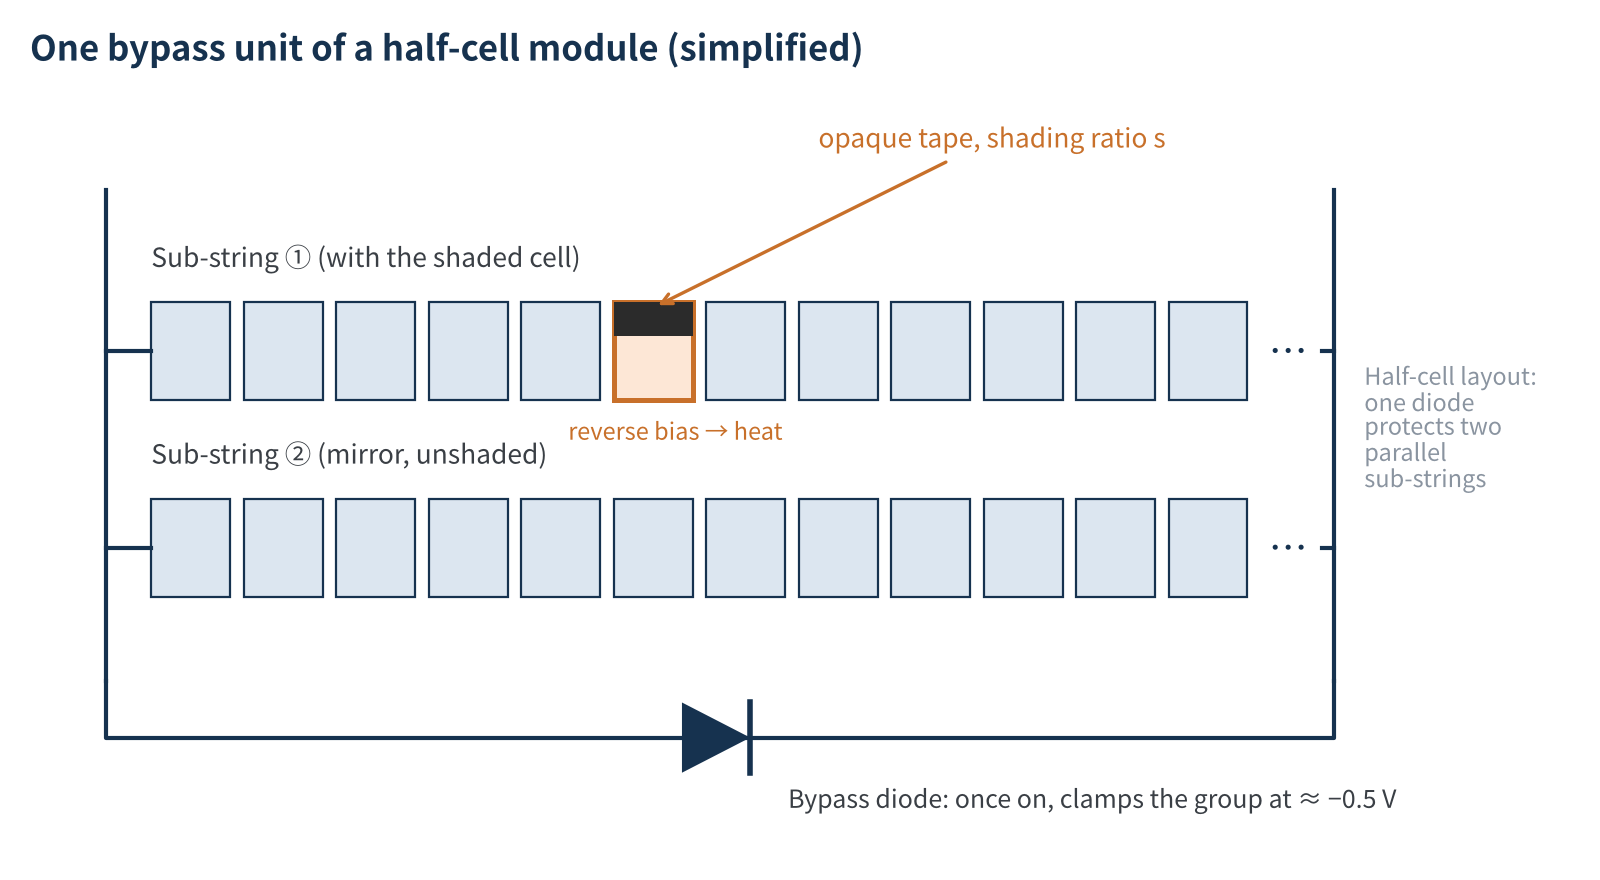
Figure 1 Simplified circuit of one bypass unit in a half-cell module (schematic)
For crystalline silicon modules the test is run with the module short-circuited. Once the voltage of the bypass unit containing the shaded cell drops to about −0.5 V, the bypass diode turns on and clamps it. The shaded cell can therefore see at most the sum of the forward voltages of the other cells in its string — about 14 V in a layout with 24 half-cells per diode. We call this the clamp voltage; every bit of the "black art" below traces back to it.
02 Where the worst case sits is decided by the cell's second quadrant
Power dissipated in the shaded cell = reverse voltage × current. The two trade off: more shading means less photocurrent of its own but a higher reverse voltage forced across it. Which shading ratio gives maximum dissipation depends on what the cell looks like in the second quadrant:
- Low shunt resistance (leaky): behaves like a resistor in reverse, current rising roughly linearly with voltage; the worst case sits at a large shading ratio, about 55 % in our model.
- High shunt resistance, high breakdown voltage: barely conducts within the clamp voltage, so current can only squeeze through on the remaining photocurrent; the worst case sits at a very small shading ratio, only 6–9 % in our model.
- Low breakdown voltage: breaks down before reaching the clamp voltage, pinning the reverse voltage near breakdown; the worst case is 100 % shading, but the dissipated power itself is much lower.
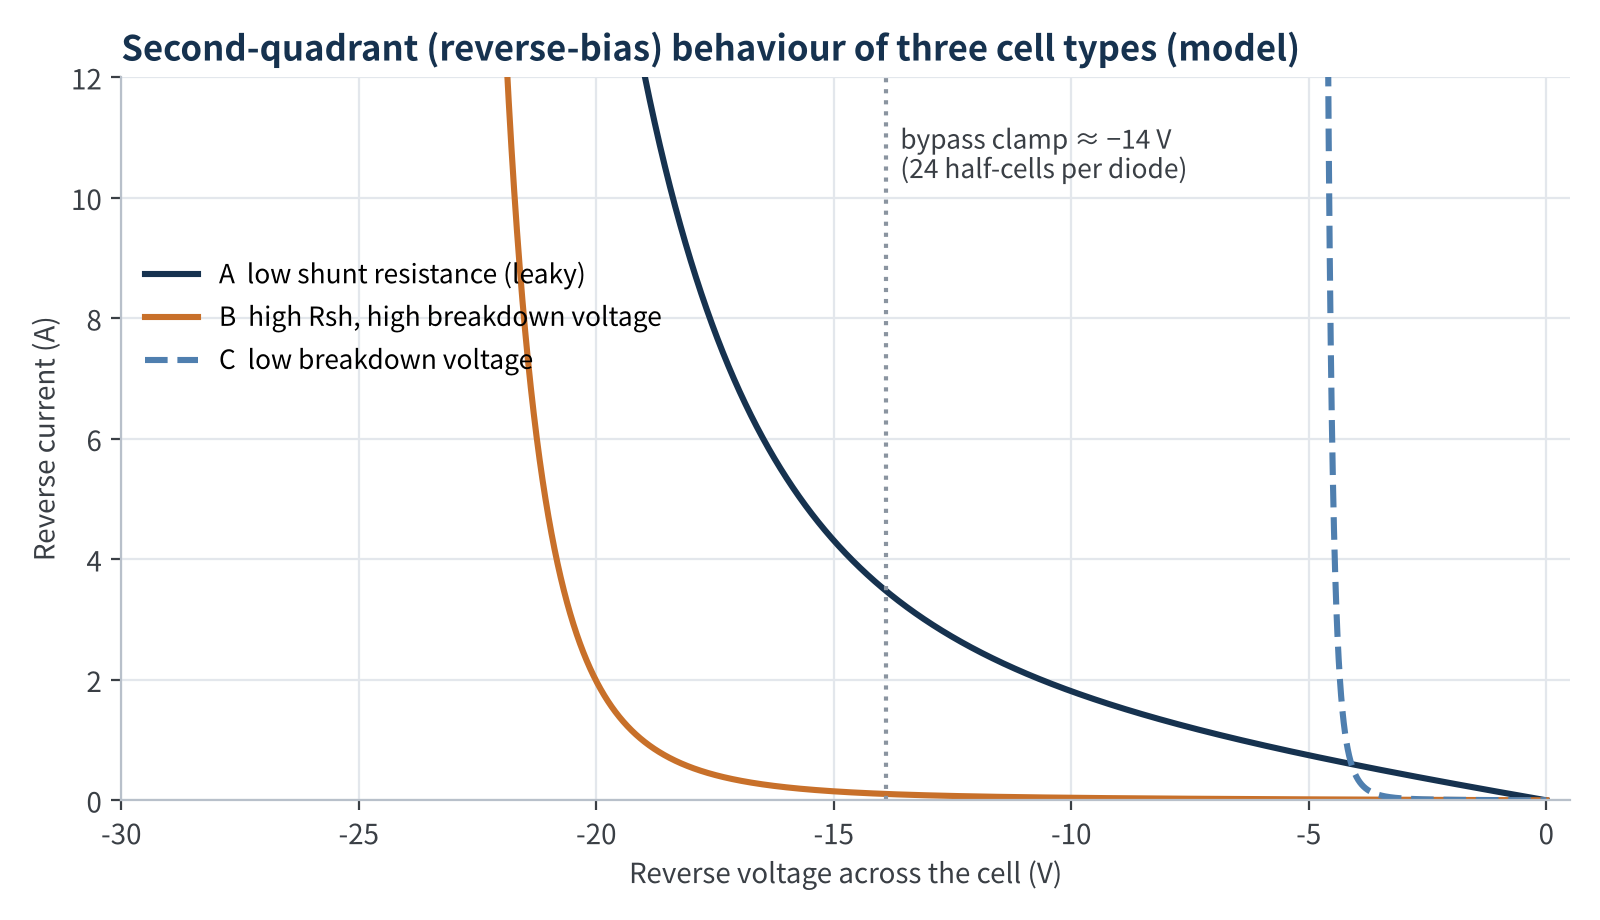
Figure 2 Second-quadrant behaviour of three cell types (Bishop reverse model, typical assumed parameters)
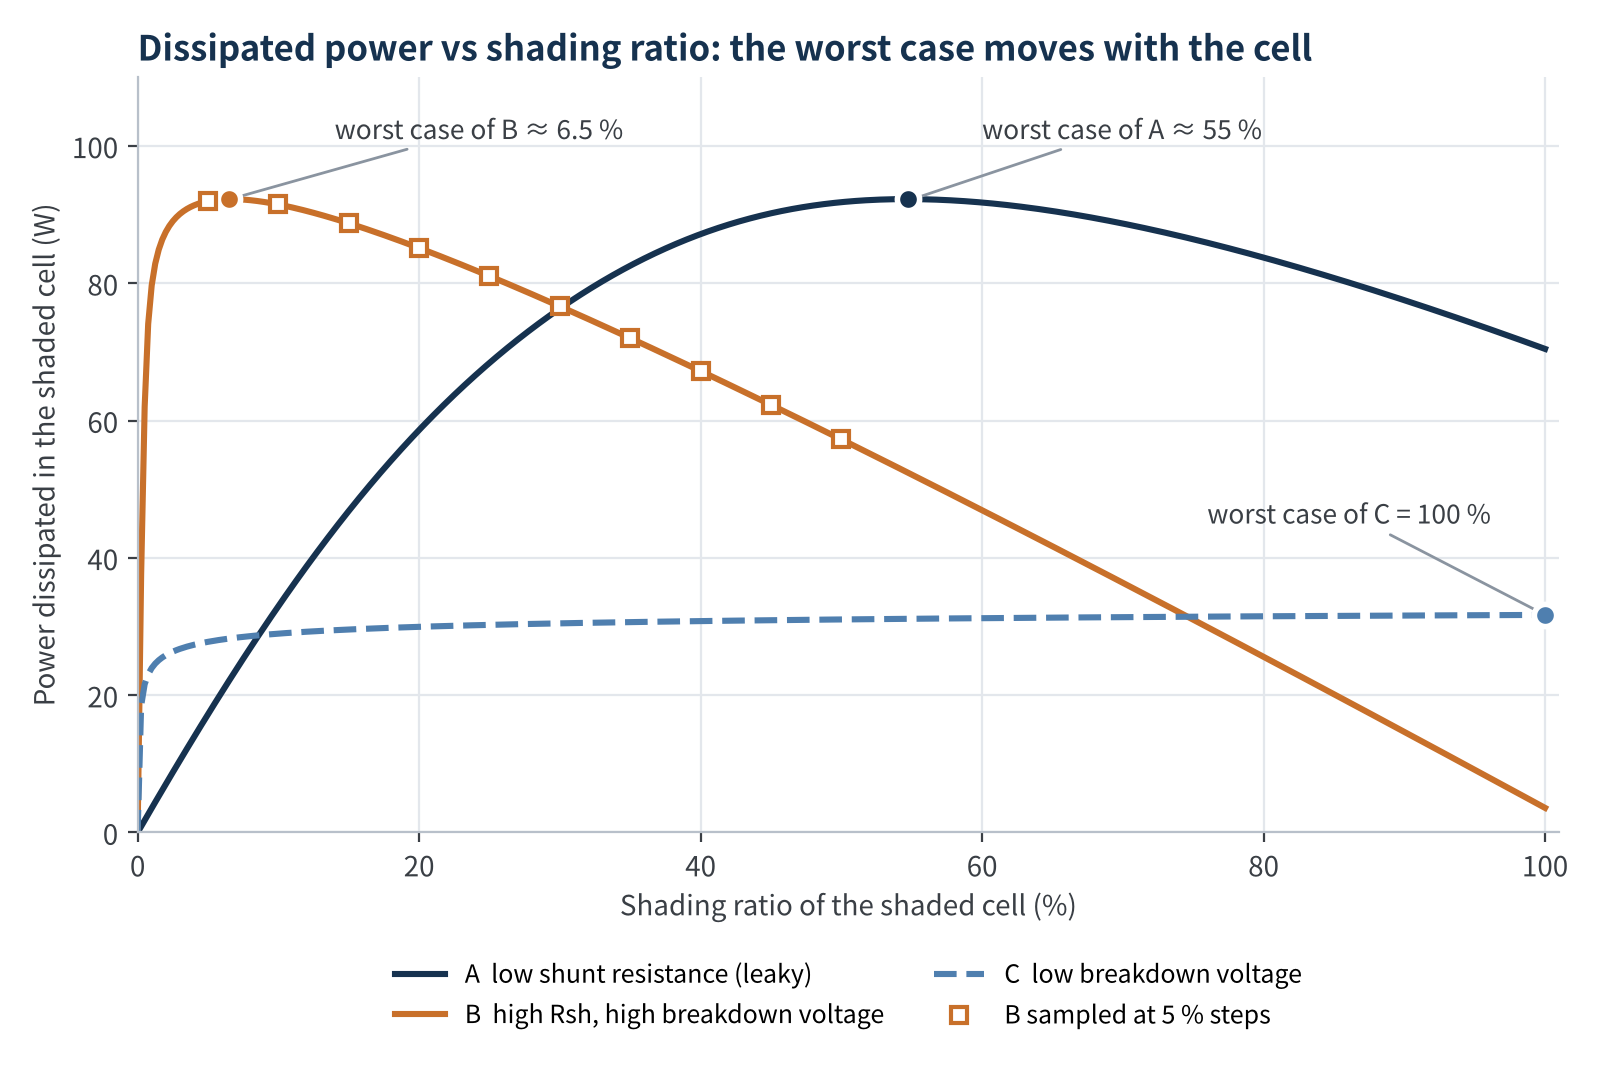
Figure 3 Power dissipated in the shaded cell vs shading ratio (simplified 144 half-cell module model)
Takeaway
Under identical test conditions the worst-case shading ratio can be 6 %, 55 % or 100 %. For high-shunt cells, "shade fully and see which cell runs hottest" can find only a fraction of the true worst-case power.
03 5 % or 1 %? Step size matters less than you think
Back to the question everyone asks. In the model we searched for the worst case with 10 %, 5 % and 1 % steps and compared each with the true maximum from a 0.25 % fine scan:
| Cell type | Rsh / breakdown | Worst-case ratio | 10 % step error | 5 % step error | 100 % shading only |
|---|---|---|---|---|---|
| A leaky | 8 Ω / −30 V | ≈55 % | −0.5 % | ≈0 | −24 % |
| B1 high Rsh | 150 Ω / −25 V | ≈9 % | −0.1 % | −0.1 % | −90 % |
| B2 high Rsh | 400 Ω / −25 V | ≈6.5 % | −0.9 % | −0.3 % | −96 % |
| B3 high Rsh | 1000 Ω / −25 V | ≈6 % | −1.3 % | −0.1 % | −98 % |
| D transition | 400 Ω / −17 V | ≈32 % | ≈0 | ≈0 | −5 % |
| C low breakdown | 400 Ω / −5 V | 100 % | 0 | 0 | 0 |
Table 1 Error of the maximum dissipated power found at different step sizes vs the true maximum (model)
The result is counter-intuitive: as long as the search range covers the peak, 5 % and 1 % steps find maximum dissipation within 0.5 % of each other, and even 10 % steps stay within 1.5 %. The power curve is flat near its peak — its ceiling is set by the bypass unit (roughly clamp voltage × current, about 92 W in the model). The cell only decides at which shading ratio that ceiling is reached.
Two things are genuinely dangerous. First, the search range misses the peak: high-shunt cells peak at 5–10 %, and the left flank is extremely steep — cell B1 dissipates only a little over half the peak power at 1 % shading. A lab that scans down from 100 % and stops once temperature drops, or tests only round tens, misses it entirely. Second, nominal ratio ≠ actual ratio: the short side of a half-cell is about 91 mm, so 1 % shading is less than 1 mm of tape displacement. Light leaking at the tape edge, the inactive cell border and stray light on the rear of bifacial modules can shift the effective electrical shading of a "nominal 5 %" by several points — right on the steep slope.
Bottom line
Cutting steps from 5 % to 1 % usually adds less than 1 % to the peak power found. Covering the range below 5 % and getting the actual shading effect right is what decides whether you have measured the true worst case.
04 Half-cut, third-cut and complex topologies: the worst case can jump
Things get worse when the breakdown voltage sits close to the clamp voltage. Holding shunt resistance fixed and varying only the breakdown voltage: below about 16 V the worst case stays at 100 %; above that, the worst case slides from nearly 100 % to about 12 % within a window of roughly 3 V, from 16 to 19 V. At 19 V, testing only at 100 % shading captures less than half of the true worst-case power.
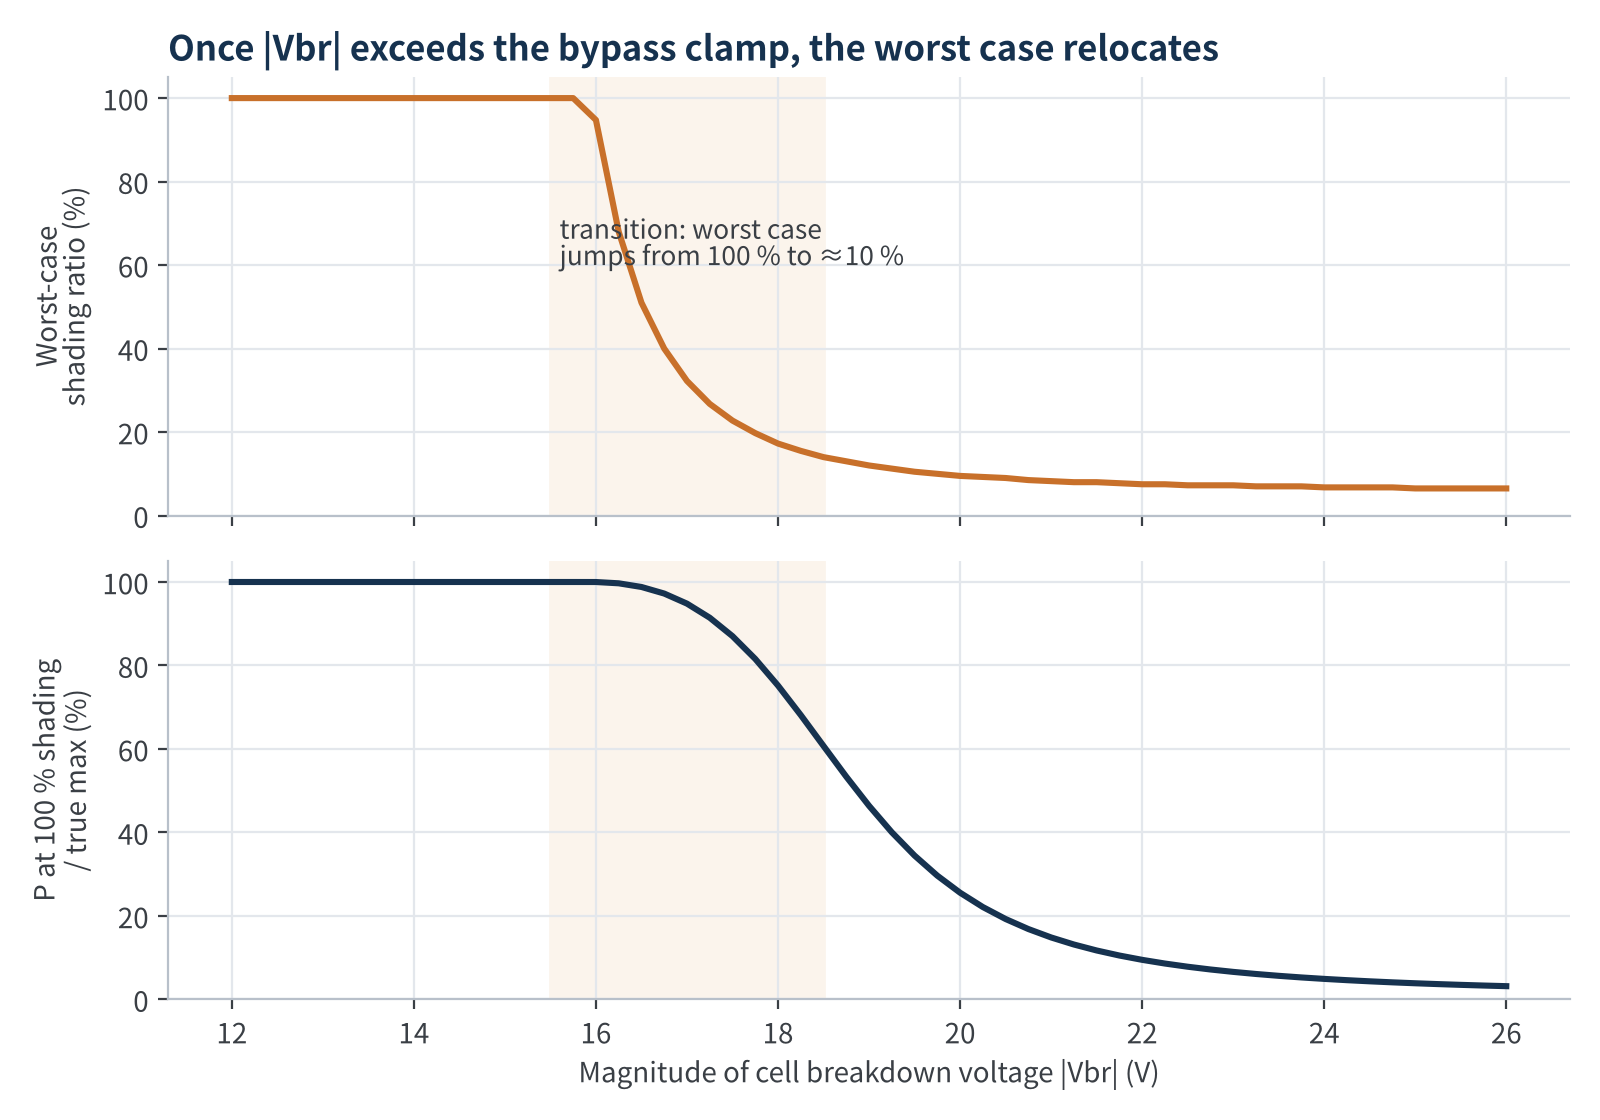
Figure 4 Worst-case shading ratio vs breakdown voltage (model, clamp voltage ≈ 14 V)
So lot-to-lot spread in breakdown voltage, or drift of the reverse characteristic as the cell heats during the test, can flip the same module between a "full shading is worst" and a "small-ratio shading is worst" regime. And module layouts are moving exactly these boundaries:
- Half-cut cells: half the current per cell and usually lower hot-spot temperatures, yet one study measured hot spots above 90 °C at a total shading ratio of only 4 % and noted that current IEC 61215-2 testing can miss them.
- Mirror sub-strings: a 2026 Solar Energy study on half-cell HJT modules found that once the bypass diode turns on, a slight short-circuit-current mismatch in the parallel, unshaded sub-string can drive an unshaded cell into deep reverse bias, making it the dominant heat source.
- Third-cut and smaller cells: even lower current per cell, but often more cells in series per bypass unit, which raises the clamp voltage and can push cells that used to be "full shading worst" into the transition region.
- Low-breakdown cells: more forgiving of shading, but research also shows cells with lower breakdown voltage form hot spots at lower temperatures too — they are not exempt.
05 Turning a black art into engineering: our recommendations
- Characterise before you shade: pre-screen with dark reverse I-V or EL/IR to know whether the test cells are leaky, high-Rsh or low-breakdown; you then know roughly where the worst case lies.
- Coarse scan, then fine scan: locate the peak with ~10 % steps over 0–100 %, then refine with 1–2 % steps on both flanks, especially the steep small-ratio side; for high-Rsh cells always cover below 5 %.
- Record the physical shading conditions: state shading direction, tape material and transmittance, and the actual shaded dimensions; the same ratio in a different direction can give a different result.
- Wait for thermal equilibrium at each step: read only once temperature has stabilised and record the scan direction, so heating-induced drift is not mistaken for the worst case.
- Report the whole curve: give power or temperature versus shading ratio, not just one "worst-case ratio", so certifiers and customers can review it.
06 Final thoughts
Disagreements in hot-spot testing are rarely about one lab lacking skill. More often the standard hands an optimisation problem that depends on cell physics over to execution details. As half-cut, third-cut, 0BB and BC cells spread, second-quadrant behaviour keeps diversifying, and "one fixed step size for every module" will fall further short.
Our view: rather than arguing 5 % versus 1 %, ask three questions first — how far is this cell's breakdown voltage from the clamp voltage? Does the search range cover small ratios? Does nominal shading match actual shading? Get those three right and hot-spot testing stops being a black art. We'd love to hear in the comments how your lab finds the worst case.
Calculation notes
- Model: 144 half-cell module with 3 bypass units; each diode protects two parallel sub-strings of 24 half-cells; module short-circuited.
- Cells: single-diode model + Bishop reverse model (a = 0.1, m = 3.7); half-cell photocurrent 7.0 A, open-circuit voltage 0.68 V (≈55 °C); unshaded cells Rsh = 300 Ω.
- Shading: opaque shading reduces photocurrent linearly; thermo-electric coupling, local current crowding, edge light leakage and rear-side irradiance are not modelled.
- Values in Table 1 and Figures 2–4 illustrate trends only and do not represent results of any specific product or laboratory.
References
- IEC 61215-2:2021, Terrestrial photovoltaic (PV) modules – Design qualification and type approval – Part 2: Test procedures (MQT 09).
- Sinovoltaics. IEC 61215 MQT 09 Hot-Spot Endurance Test: Why It Matters for Solar Module Reliability, 2026.
- Özkalay E. et al. The effect of partial shading on the reliability of photovoltaic modules in the built-environment. EPJ Photovoltaics 15, 7 (2024).
- Qian J. et al. Analysis of hotspots in half cell modules undetected by current test standards. Australian National University.
- Podlowski L. et al. Hot spot testing of bare and laminated cells, PI Berlin, NREL PV Module Reliability Workshop, 2015.
- pv magazine. Scientists explain unexpected hotspot formation in half-cell heterojunction modules, 2026-08-05 (Solar Energy).
- Bishop J. W. Computer simulation of the effects of electrical mismatches in photovoltaic cell interconnection circuits. Solar Cells 25 (1988).
PV Materials Lab
PV Materials Lab
A PV R&D and technology team with 10+ years of experience | In-depth technical knowledge sharing
Materials · Reliability · Failure analysis · Standards & certification · Products · Processes
Exploring AI + PV — collaboration welcome
Disclaimer:
- Original content reflects the authors' personal views, is for reference only and does not constitute investment advice.
- Reproduced and cited content is attributed to its source, respecting original work.
- Some content is AI-assisted (chart generation, data retrieval, concept explanations, etc.); the core framework and key content are written by our technical team and reviewed by humans.
- If anything is inaccurate or infringing, please leave a comment or contact us.