
584 GW: BNEF Cuts Its Global Solar Outlook Again. What Does China's −29% Mean?
In brief
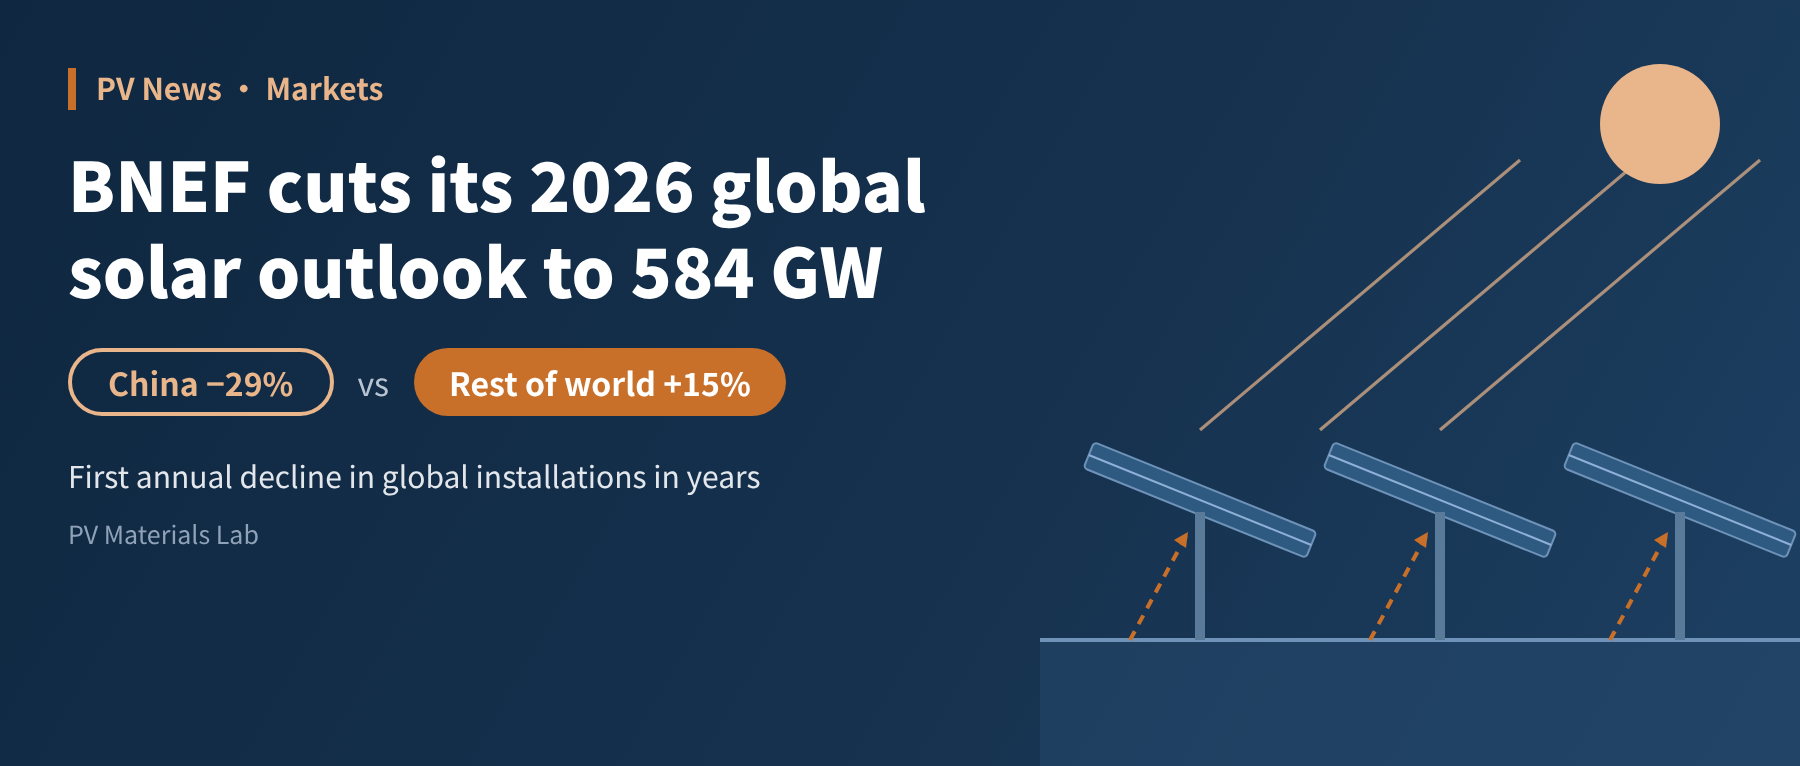
BNEF has lowered its outlook for 2026 global solar installations to 584 GW, down 10.8% year on year. China falls from 383 GW to 271 GW (−29%), while markets outside China grow 15% to 313 GW. We unpack how these figures are measured, the real reasons for China's decline, the year-end pressure implied by the BNEF forecast, and what the shift in demand means for module products and reliability.
On 15 October, BloombergNEF (BNEF) cut its outlook for 2026 global solar installations once again, to 584 GW, about 71 GW less than in 2025. It would be the first annual decline in global solar installations in many years, and almost all of the drop comes from China. The headline looks alarming, but what really matters to people in the industry is how the figures are measured, the timing and the structure behind them.
01The numbers first
According to pv magazine's report, BNEF's key figures are:
| Metric | 2025 (est.) | 2026 (outlook) | Change |
|---|---|---|---|
| Global new installations | 655 GW | 584 GW | −10.8% |
| China | 383 GW | 271 GW | −29% |
| Rest of world | 272 GW | 313 GW | +15% |
Table 1 Key figures in BNEF's 2026 solar outlook (DC; source: [1])
The trajectory of the revisions is even more telling. In Q1 2025, BNEF's outlook for 2026 was still 753 GW; by December 2025 it had fallen to 649 GW; now it is 584 GW. In 18 months, the forecast for the same year has been cut by 169 GW, more than 60% of all installations outside China in 2025.
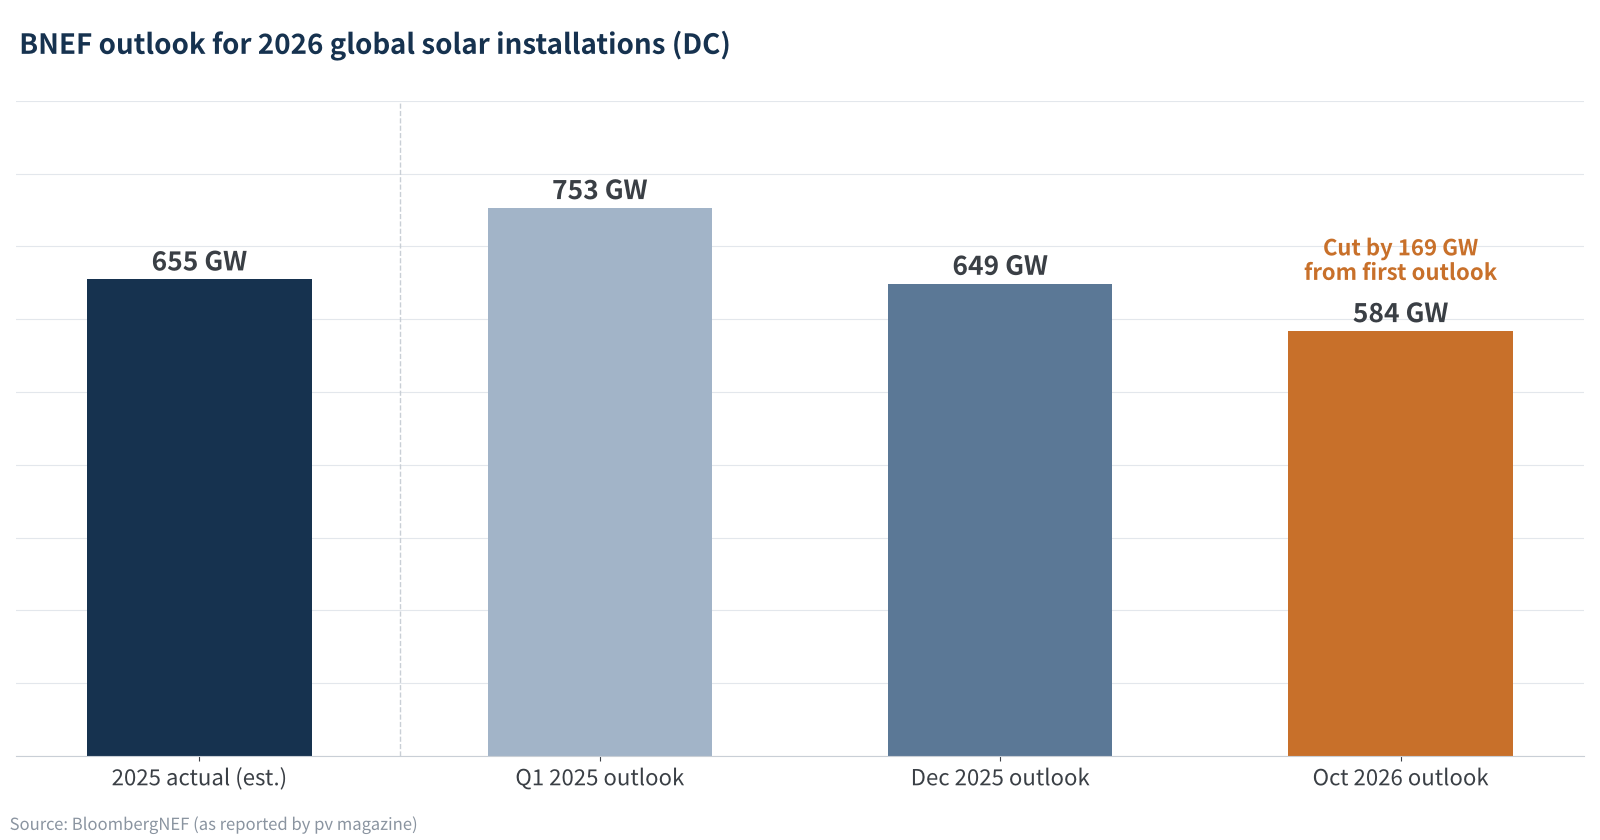
Figure 1 Three revisions of BNEF's outlook for 2026 global solar installations
The biggest revision is for China: in Q4 2025 BNEF still expected China to install 341 GW in 2026; now it expects only 271 GW. Markets outside China, by contrast, are doing slightly better than BNEF's December forecast of 308 GW.
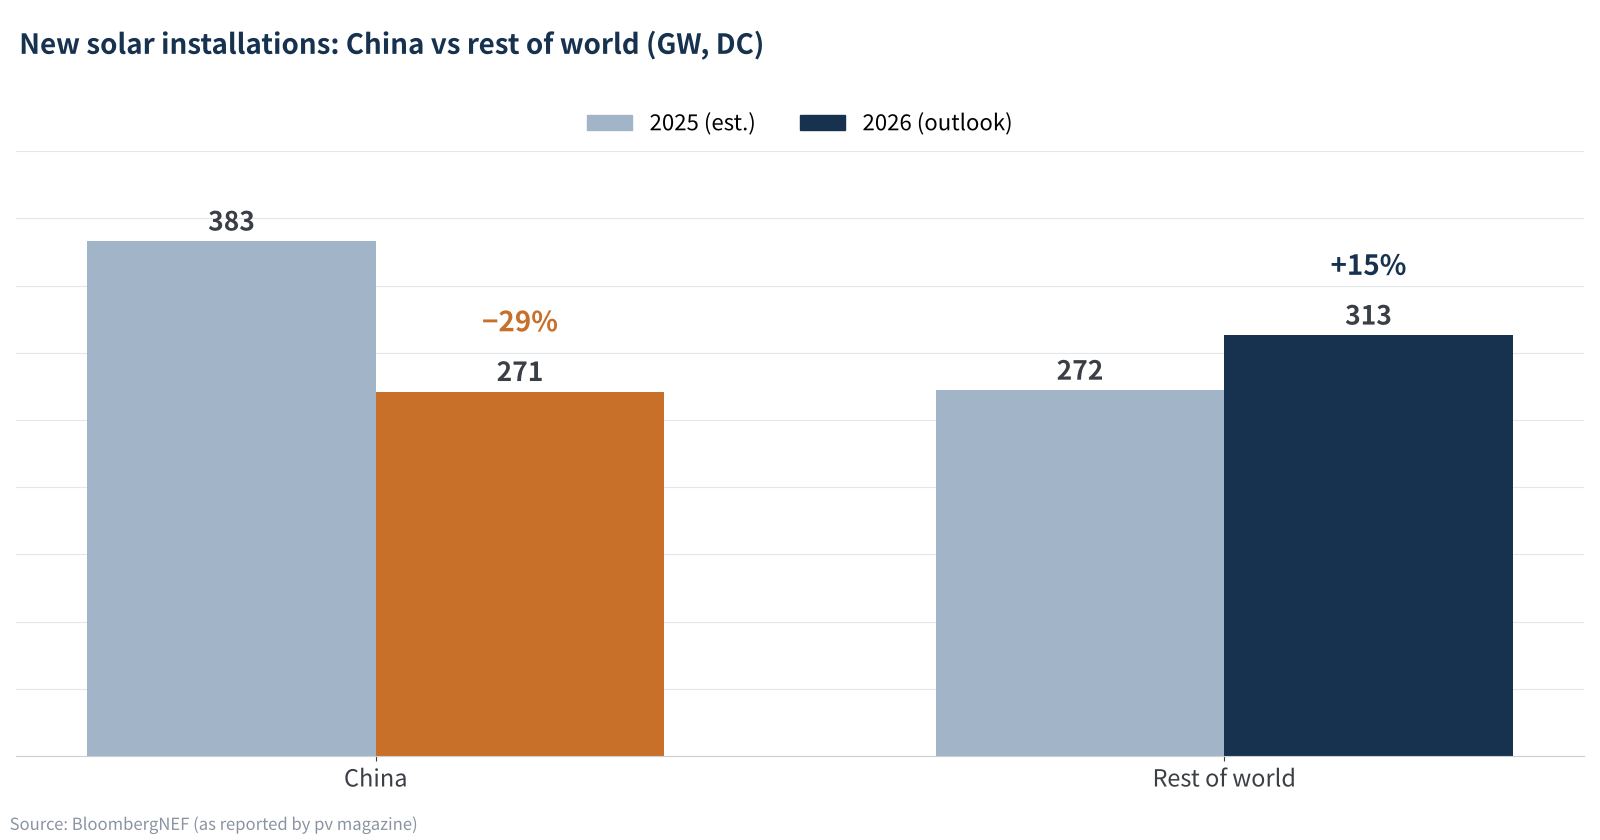
Figure 2 Diverging trends in China and the rest of the world
The global decline is not a general retreat: it is a sharp one-sided drop in China, with moderate growth elsewhere.
02A note on measurement: 383 GW and 315 GW describe the same thing
Many readers ask why China's National Energy Administration (NEA) reports 315.07 GW of new grid-connected solar for 2025, while BNEF says 383 GW.
The answer is DC versus AC. BNEF counts module nameplate power (DC); the NEA counts grid-connected capacity (AC, roughly equal to inverter rated power). Ground-mounted plants in China commonly use DC/AC ratios of around 1.2 or higher, and 383 ÷ 315 ≈ 1.22 falls right in that range.
Applying the same ratio, BNEF's 271 GW (DC) is roughly 223 GW (AC). The China Photovoltaic Industry Association (CPIA) roadmap published in February expects 180–240 GW of new installations in China in 2026. The CPIA does not state the basis, but its annual figures usually follow the NEA's grid-connected (AC) basis; on that basis, BNEF's new figure sits in the upper-middle part of the CPIA range and is not "extremely pessimistic".
- Reading institutional forecasts: check first whether a figure is DC or AC. The two can differ by about 20% and cannot be compared directly.
- Reading module demand: production schedules and shipments are on a DC basis; AC figures must be multiplied by the DC/AC ratio to convert them into module volumes.
03Why has China fallen so sharply?
In the first half of 2026, China added about 71.8 GW of grid-connected solar (71.77 GW on the NEA's grid-connection basis), against 212.2 GW in the same period of 2025, a drop of about 66%. Three factors are stacked on top of each other:
- Demand pulled forward: in H1 2025, a large number of projects rushed to connect before the cut-off date for market-based pricing of renewable power (Document No. 136), using up demand that would otherwise have fallen in 2026. The high base makes the year-on-year comparison look especially bad.
- Grid absorption limits: the national solar utilisation rate fell to 91.4% in H1 2026, compared with 94.8% for 2025 as a whole. Lower midday power prices and more curtailment directly reduce expected returns on new projects.
- A shift in policy focus: the 15th Five-Year Plan for Renewable Energy Development, published on 23 July, no longer pursues installed capacity alone. It states that by 2030 new centralised wind and solar plants should in principle have a firm (dependable) output of at least 10% of capacity, with qualified projects encouraged to exceed 20%, putting energy storage at the centre.
BNEF analyst Jenny Chase's view is that the Chinese market is heading towards saturation; batteries and EVs can only slow the deceleration a little, not stop it. We see it similarly: this looks more like a return from "rush-to-install mode" to a "new normal under grid constraints" than a disappearance of demand. By the end of July 2026, China's cumulative solar capacity had reached 1.286 TW, overtaking coal for the first time, and at that scale growth inevitably has to shift down a gear.
04An easily overlooked detail: 271 GW is not "conservative"
The NEA's January–August power statistics, released in late September, give a more accurate starting point (the original draft estimated about 95 GW by subtracting cumulative totals; we have updated it with the official statistics, see the calculation notes at the end):
- January–August: China added 97.19 GW (AC) of solar in 2026, 135.53 GW less than a year earlier, which puts the same period of 2025 at about 232.7 GW. August alone added about 11 GW.
- The four months implied by BNEF: to reach 271 GW (DC) ≈ 223 GW (AC), about 126 GW must be added from September to December, more than 31 GW a month on average.
- The same period last year: China added about 82 GW from September to December 2025, including more than 40 GW in December alone.
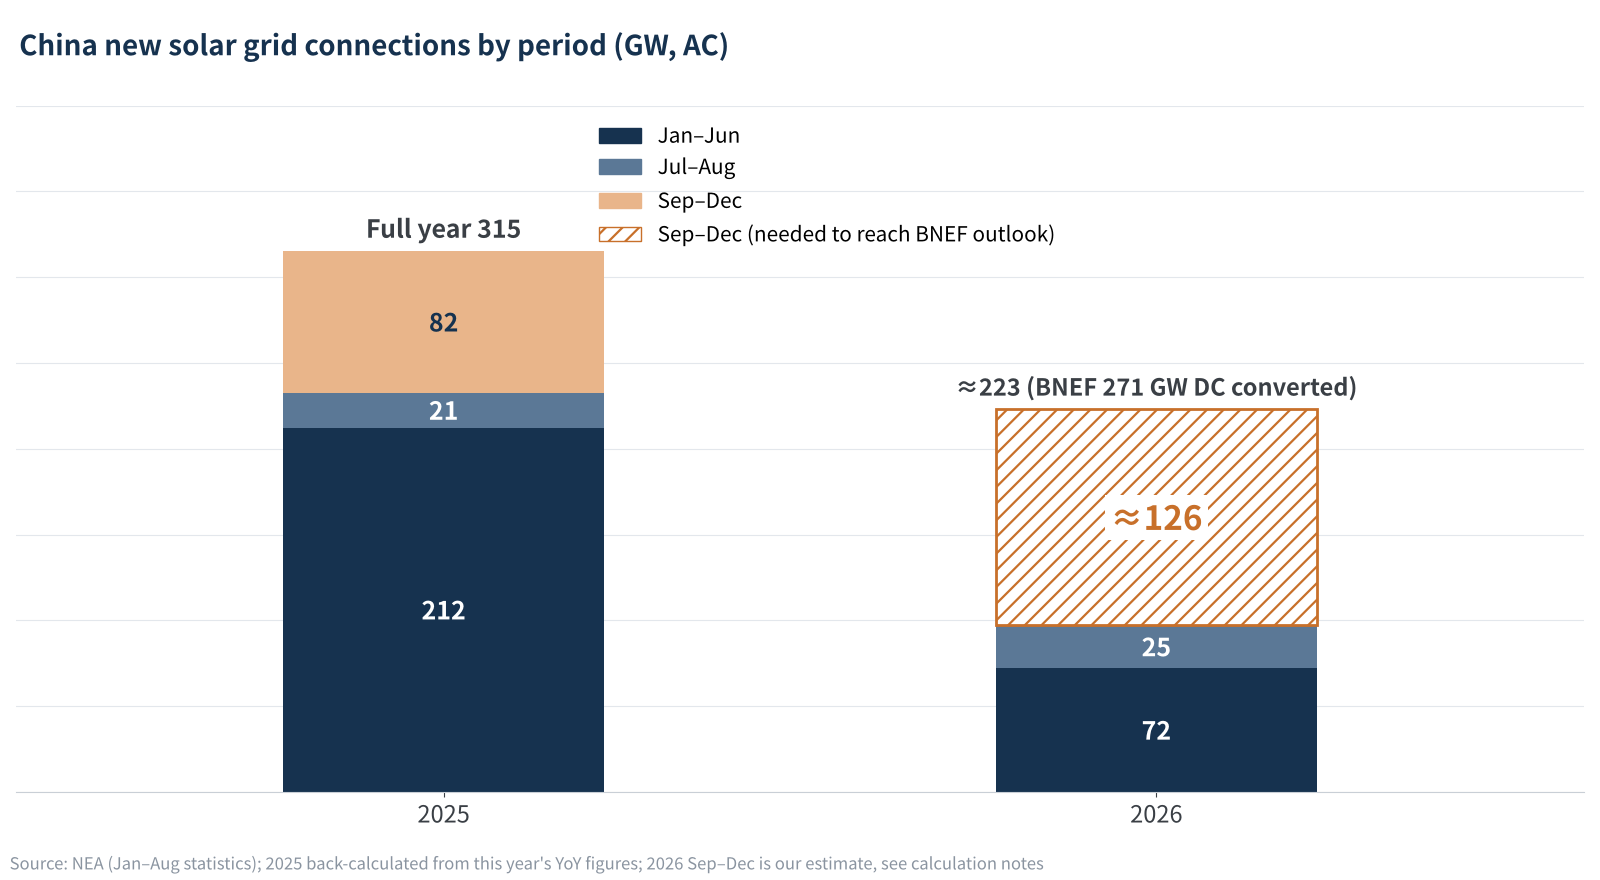
Figure 3 China's grid-connection pace: how much catching up Q4 2026 needs
In other words, BNEF's figure implies a year-end sprint about 50% stronger than the same period last year. A year-end connection peak is a long-standing pattern in China, and the results of provincial auctions for mechanism-based tariffs may release a batch of projects at once, but the gap is large. As of writing, the NEA published January–September electricity consumption data on 21 October, but January–September capacity statistics are not yet out. Judging by the roughly 25 GW added in July and August combined, we think the chance that China's actual full-year figure comes in below BNEF's forecast is at least as high as the chance that it comes in above.
With BNEF's 271 GW, the question is less "how much was it cut" and more "can the last four months make up 126 GW".
05Rest of world +15%: where is the growth, and what does it look like?
The growth markets BNEF names include India, the Philippines, Nigeria and Malaysia, with growth in Nigeria and the Philippines coming almost entirely from residential and commercial systems. Another BNEF report has also noted that, with Chinese utility-scale solar pulling back, non-utility solar has become the largest sector of global renewable energy investment.
From a technical standpoint, this means the profile of module demand is changing:
- Size and weight: residential and commercial rooftops are more sensitive to handling and load-bearing limits, so the share of small-to-medium formats and lightweight modules will rise. The logic of simply chasing ever larger, higher-power modules no longer wins everywhere.
- Environmental robustness: Southeast Asia and West Africa are hot, humid and UV-intense. PID, damp-heat ageing and the weatherability of backsheets and encapsulants matter more for reputation than nominal lab efficiency.
- Channels and certification: distributed markets are fragmented with small orders, so certification for market access, warranty terms and local service capability carry much more weight.
- Solar plus storage: whether through China's firm-capacity requirements or overseas demand for home storage, "the value of the generation profile" is replacing "peak power" as a new yardstick.
One more warning: when demand is falling and prices are under pressure, cutting material specifications is the most common way to reduce cost: thinner glass, lower encapsulant grammage, and savings on frames and ribbons. According to the CPIA, China's module output in H1 2026 was 201.3 GW, down 35.1% year on year, with low capacity utilisation. Buyers and plant owners should be particularly alert to these risks.
06Final thoughts
Rather than a turning point for the PV industry, 584 GW is better seen as a structural gear change: China is shifting from capacity expansion to grid integration and value, and global growth is shifting from large ground-mounted plants to fragmented distributed markets.
For manufacturers, this is no longer a contest of who has the most capacity, but of whose products best fit the new applications and whose quality holds the line under cost pressure. Public reports have not yet shown whether BNEF's original report breaks the figures down by technology such as TOPCon, BC and HJT; we will keep following it, and we will come back to check the numbers once the NEA publishes full-year data.
How do you see China's Q4 grid-connection pace? We would be glad to hear from you.
References
- pv magazine: BloombergNEF forecasts 584 GW of solar installations in 2026, 2026-10-15; pv magazine USA: China solar down 29%, everywhere else up 15%, 2026-10-16
- pv magazine: China's solar capacity hits 1.28 TW, accounts for 31.5% of total power capacity, 2026-09-03
- pv magazine: China puts battery storage at center of renewable energy strategy, 2026-08-05
- National Energy Administration (NEA): National power statistics for January–August 2026, 2026-09-24; NEA press conference on H1 2026 renewable energy grid operation, 2026-07-30
- NEA: 2025 solar power construction data; national power industry statistics for January–August 2025
- China Photovoltaic Industry Association (CPIA): China PV Industry Development Roadmap (2025–2026), 2026-02; review of the PV industry in H1 2026, 2026-07
- National Development and Reform Commission and NEA: 15th Five-Year Plan for Renewable Energy Development, 2026-07-23
- National New Energy Consumption Monitoring and Early Warning Center: 2025 national renewable energy grid integration, 2026-02
A PV R&D and technology team with 10+ years of experience | In-depth technical knowledge sharing
Materials · Reliability · Failure Analysis · Standards & Certification · Products · Processes
Exploring AI + PV; collaboration welcome
Disclaimer:
1. Original content reflects the authors' personal views only, is for reference only and does not constitute investment advice.
2. Reposted and cited content is credited to its source, out of respect for original work.
3. Some content was produced with AI assistance (chart generation, data retrieval, concept explanations, etc.); the core framework and key content were written by our technical team and reviewed by people.
4. If anything is inaccurate or infringes your rights, please leave a message or contact us and we will deal with it.