
The Desert's Hidden Killer: How Much Yield Do AR Coatings Worn Off by Sand Really Cost?
In brief
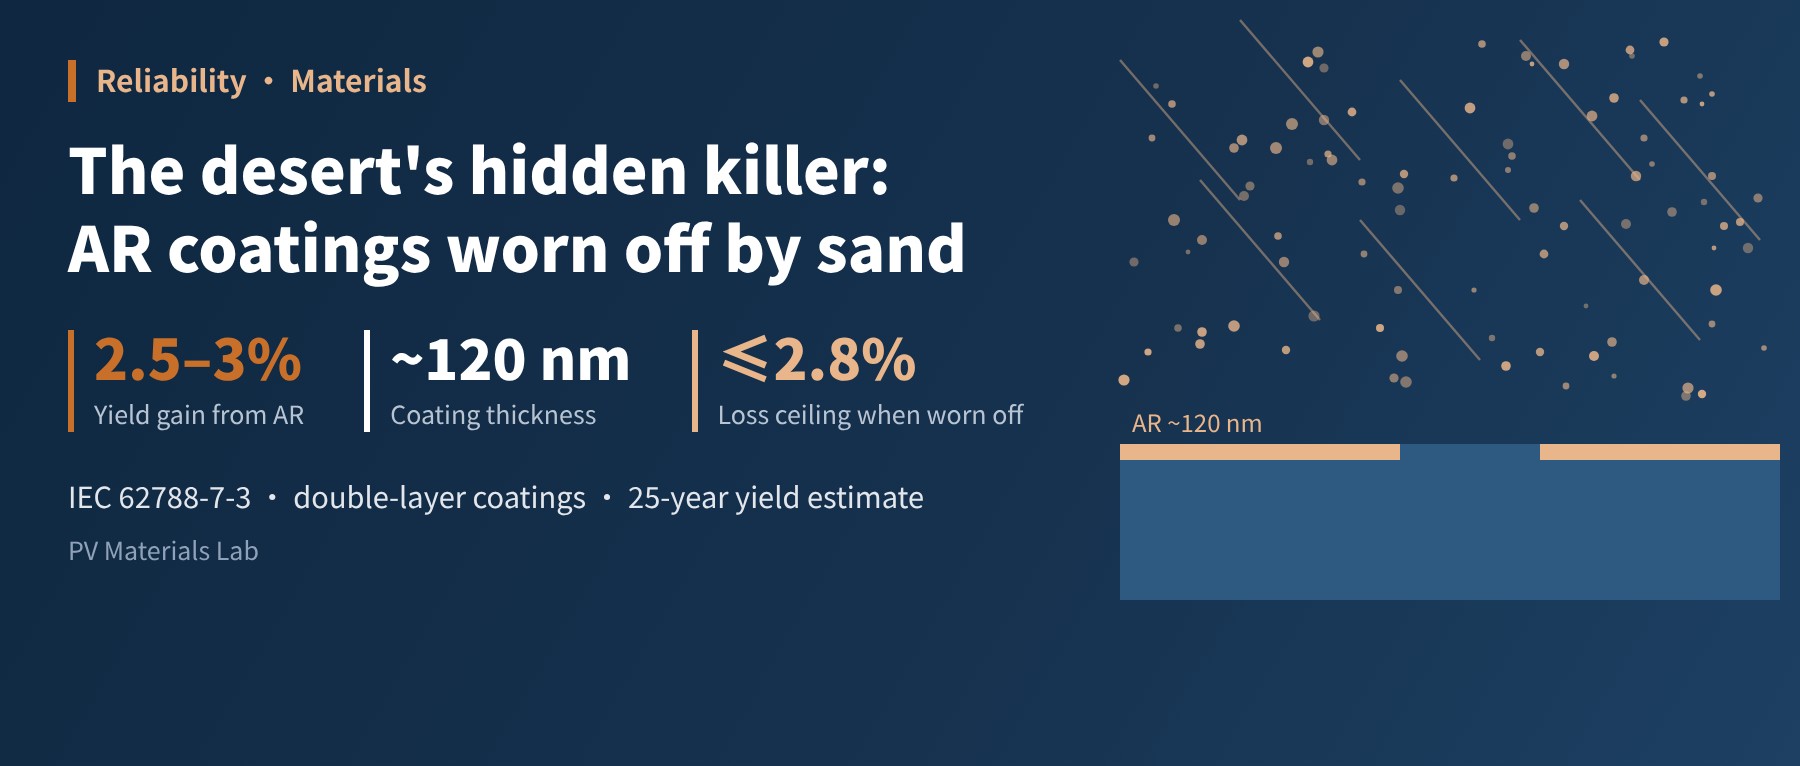
The roughly 120 nm anti-reflective (AR) coating on module glass delivers a 2.5–3% yield gain, but under windblown sand erosion and frequent dry cleaning in desert plants it may be worn away within a few years. Starting from thin-film optics, we review the four abrasion tests in IEC 62788-7-3 and the falling-sand method, look at the process routes by which double-layer coatings improve abrasion resistance, and use a simple model to estimate the impact of coating loss on the 25-year yield of bifacial modules.
At China's large desert and Gobi bases, modules face more than heat and UV: there is windblown sand all year round, plus increasingly frequent dry robotic cleaning to deal with soiling. Sand impacts and brush strokes take their toll first on the outermost layer of the glass, an AR coating only a hundred-odd nanometres thick. It is not as conspicuous as a cell crack and does not show up on EL images, yet it determines whether a module gets 2–3% more light. Let us do the maths: how much of this coating can sand wear away, and once it is gone, how much less energy does a bifacial module produce?
01First, what is this coating worth in yield?
When light passes from air into glass, the difference in refractive index (about 1.0 versus 1.52) reflects about 4% of the light at normal incidence. An AR coating adds a thin film with a refractive index between the two, so that the reflections from its upper and lower interfaces interfere and cancel out. The ideal single-layer index is close to 1.23, and no dense natural material has such a low index, so the industry uses porous silica: introducing large numbers of nanopores into SiO2 "dilutes" the effective index to around 1.25–1.30.
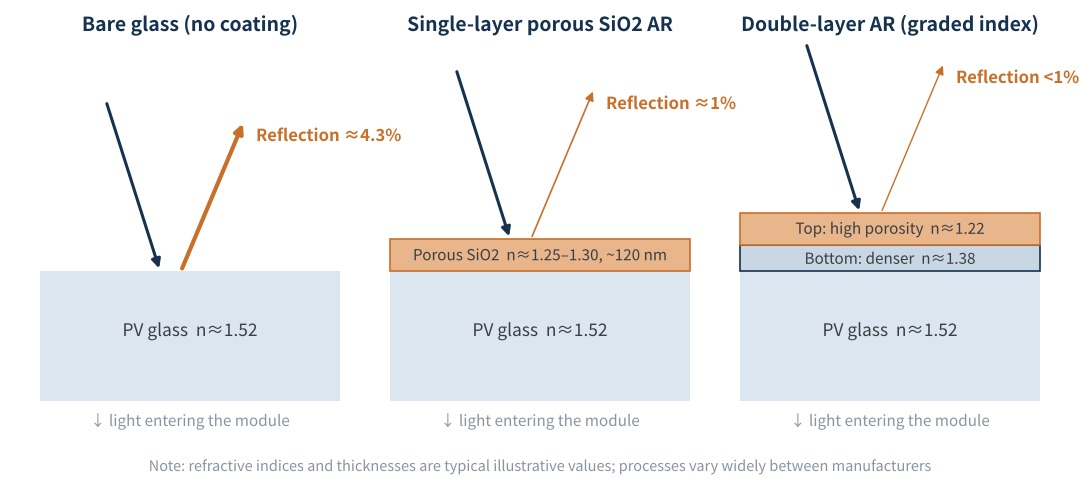
Figure 1 Bare glass, single-layer and double-layer AR coatings
How much does it deliver? The US DuraMAT consortium says typical porous silica AR coatings increase light transmission by about 3%, and the industry generally reckons commercial AR-coated glass raises module power by about 2.5–3.0%. For a GW-scale plant, that is a difference of tens of millions of kWh.
The problem is that an AR coating works by interference, and interference is highly sensitive to film thickness. We made a simple estimate using the transfer-matrix method of thin-film optics: assuming an initial thickness of 125 nm worn down uniformly, the transmission gain does not fall linearly. Removing the first 20% of the thickness loses only about 9% of the gain, but by the time the thickness is down to about half, half the gain is gone, and the decline speeds up from there.
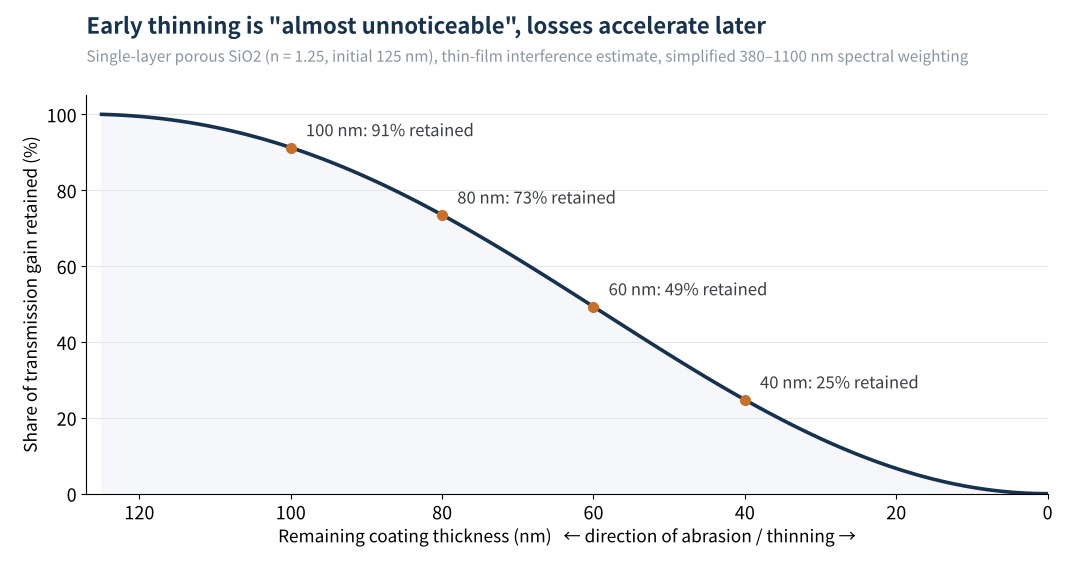
Figure 2 Coating thinning and share of transmission gain retained (estimate)
This agrees with field measurements by a US national laboratory team (Karin et al.): they found that AR coatings mainly "thin" slowly at 1.4–5.0 nm per year, and because of the physics of interference films, performance loss accelerates as the coating thins. They projected coating lifetimes (to 80% of initial performance) of 7.5 to 25 years; at the higher thinning rate, AR coating degradation alone causes module power loss of about 0.14% per year over the first 20 years. More extreme still, on some modules after 8 years in the field, the coating could be wiped off completely with a single wet pass of lens tissue.
AR coating loss is "slow first, fast later": small changes in transmittance at early inspections do not mean the coating is not thinning; by the time a colour change is visible to the eye, most of the gain is usually gone.
02Three kinds of "sandpaper" in the desert
At China's north-western bases, AR coatings are worn from roughly three directions, each with a different mechanism:
- Windblown sand erosion: sand carried by strong winds strikes the glass at a certain speed and angle, causing micro-pits and coating spallation. Saltating sand is concentrated within a few dozen centimetres of the ground, so the lower edges of modules, the windward side and low-mounted arrays bear the brunt.
- Falling and accumulated sand: after a sandstorm, sand settles on the module surface under gravity and slides back and forth with wind and thermal expansion, leaving fine scratches.
- Dry cleaning: to save water, desert plants commonly use brush-type robots for dry cleaning. The more sand on the surface and the more often it is cleaned, the more often the brushes grind sand across the coating. This is often the main long-term source of AR coating wear.
A 2024 study by the Qatar Environment and Energy Research Institute (QEERI), published in the IEEE Journal of Photovoltaics, provides direct evidence. Nine module types and five AR coupon types were exposed in Doha's desert climate to 18 months of dry-brush robot cleaning at daily, weekly and no-cleaning schedules. Abrasion resistance varied greatly: five of the nine module types lost more performance the more often they were cleaned, while the other four did not show this clearly. The authors recommend field-testing specific "robot plus module" combinations to estimate coating degradation rates reliably.
A Chinese review of windblown sand effects on desert PV modules also notes that sand flows cause ground erosion and deposition, surface soiling, erosive wear of module surfaces and even structural damage, while current load codes do not yet cover the effects of windblown sand on module safety and yield, and there are no systematic guidelines for sand-resistant design.
One more easily overlooked detail: abraded glass not only "transmits less" but also "scatters more". A study by Spain's CIEMAT found that after abrasion with two different sands, samples had almost identical solar transmittance (93.9% and 94%) but haze of 1.2% and 3.2% respectively, with clearly different transmission spectra, indicating two different failure mechanisms (mainly reflection loss or mainly absorption loss). Looking at a single transmittance figure can misjudge the true extent of wear.
03Falling-sand abrasion testing: how do the standards measure it?
In the past, the industry assessed glass abrasion resistance mostly with methods borrowed from architectural and automotive glass, the most common being Germany's DIN 52348 "sand trickling" method and the US ASTM D968: a specified quantity of standard sand falls from a fixed height through a guide tube onto an inclined sample, and transmittance or reflectance is compared before and after. Fraunhofer ISE and others have studied PV glass systematically with this method, often using sand quantities of 0.75 kg, 1.5 kg and 3 kg, and found that sand type and impact angle both strongly affect results.
In February 2022, the IEC published IEC 62788-7-3, an abrasion methods standard specifically for PV (Amendment 1 followed in 2024), bringing four test methods together:
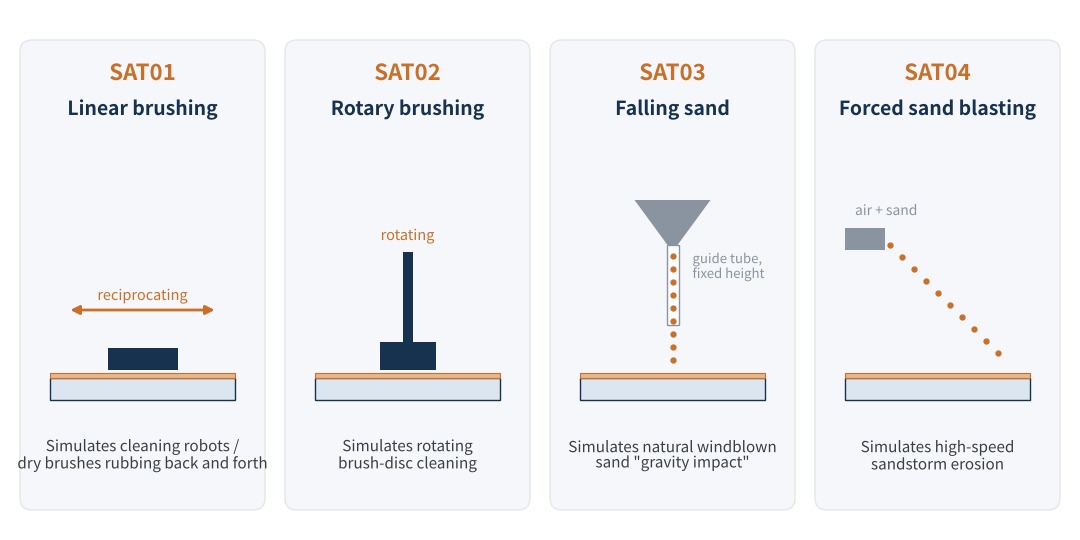
Figure 3 The four abrasion test methods in IEC 62788-7-3
| Method | What it simulates | Main use |
|---|---|---|
| SAT01 linear brushing | Cleaning robots, dry brushes | Cleaning resistance of front-surface coatings |
| SAT02 rotary brushing | Rotating brush-disc cleaning | Cleaning resistance of front-surface coatings |
| SAT03 falling sand | Gravity impact of natural windblown sand | Front-surface coatings, backsheets |
| SAT04 forced sand blasting | High-speed sandstorm erosion | Front-surface coatings, backsheets, vehicle-integrated PV |
| IEC 60068-2-68 Lc2 | Blowing-sand environmental test | Comparative verification of complete modules |
Table 1 Comparison of common abrasion test methods
One point deserves special emphasis: IEC 62788-7-3 is a "methods standard", not a "pass/fail standard". It specifies how to abrade, which abrasives to use (such as ISO 12103-1 Arizona test dust and DIN 52348 sand) and how to characterise the results, but it sets no common threshold for how much transmittance loss counts as a pass; it is mainly for relative comparison between materials. China's JC/T 2170-2013, Anti-reflective coated glass for PV modules, sets durability requirements for coated glass, but refer to the standard itself for the specific methods and limits.
So when a supplier says its product "passed falling-sand / abrasion testing", always ask three things: what sand was used, how much abrasion was applied, and how much transmittance and haze changed before and after. Data from different laboratories are almost impossible to compare without their test conditions. Fraunhofer's brushing tests showed that 1,000 brush cycles with hard corundum dust caused a relative transmittance loss of about 3%, and that dust type was the most significant factor, while brush weight and speed mattered less.
The test methods exist, but a common "pass mark" does not yet. Abrasion data must be read together with sand type, sand quantity or brush cycles, and transmittance and haze.
04Double-layer coatings: how hardness is "built up"
The dilemma of single-layer porous SiO2 coatings is this: more pores mean a lower index and better anti-reflection, but a "looser" film that is less abrasion-resistant. This is a seesaw inherent to the material. Double-layer coatings divide the work between two layers, so optical and mechanical performance can be optimised separately.
Common process routes in the industry today include:
- Graded-index double layer: a denser bottom SiO2 layer with a slightly higher index (about 1.35–1.40) bonds more strongly to the glass and blocks outward migration of sodium ions; a highly porous, low-index top layer handles anti-reflection. By our estimate, a well-matched double layer is no worse than a single layer in anti-reflection and flatter across the spectrum.
- Dense protective layer: a denser SiO2 "armour" layer a dozen or so nanometres thick on top of the porous film trades a little optical gain for a clear improvement in abrasion resistance. Our estimate puts the gain loss from a 15 nm dense top layer at around 0.1 percentage points.
- Closed pores / hollow particles: hollow or mesoporous SiO2 particles replace conventional solid particle packing; pores are "wrapped" inside the particles, keeping the index low while improving framework strength and weatherability.
- Hybridisation and doping: adding organosilicon hybrid components to the sol, or doping with elements such as aluminium or zirconium, increases crosslink density and film hardness.
- Coating plus tempering co-curing: PV glass is generally roll-coated with sol and then sintered at high temperature during tempering. Sintering temperature and time directly affect film densification and are an important source of differences in abrasion resistance between suppliers.
Note that greater hardness is not "free". Densification usually means lower porosity, which affects both anti-reflection and some of the anti-soiling properties of porous films. The "pencil hardness xH" figures common in marketing are measured under differing conditions; we recommend selecting on transmittance retention after falling-sand or brushing tests rather than on a single hardness grade.
A study by a team from Mohammed First University in Morocco under desert conditions offers an encouraging signal: the AR-coated glass they tested lost only 2.6% of its optical performance after 1,500 abrasion cycles (equivalent to weekly cleaning for 29 years), and in a simulated 40 MW plant, AR modules raised annual output from 69 GWh to 72 GWh, 5.5% more than uncoated modules, cutting the cost of electricity by 2.7%. A well-made coating can withstand desert cleaning.
05Long-term impact of coating loss on bifacial module yield
Bifacial modules add another dimension: front and rear glass wear differently. The front takes falling sand and cleaning robots directly; the rear faces downwards, is less exposed to falling sand and is rarely cleaned, so it mainly faces impacts from saltating sand near the ground. The front coating therefore usually wears faster and the rear more slowly, though soiling on the rear is often left unattended.
To quantify the impact, we set three scenarios (parameters in the calculation notes at the end): A is a durable coating thinning 1.4 nm per year; B is a standard single-layer coating thinning 5 nm per year (the upper end of the measured range); C is a severe sand area combined with frequent dry cleaning, wearing the coating off in about five years.
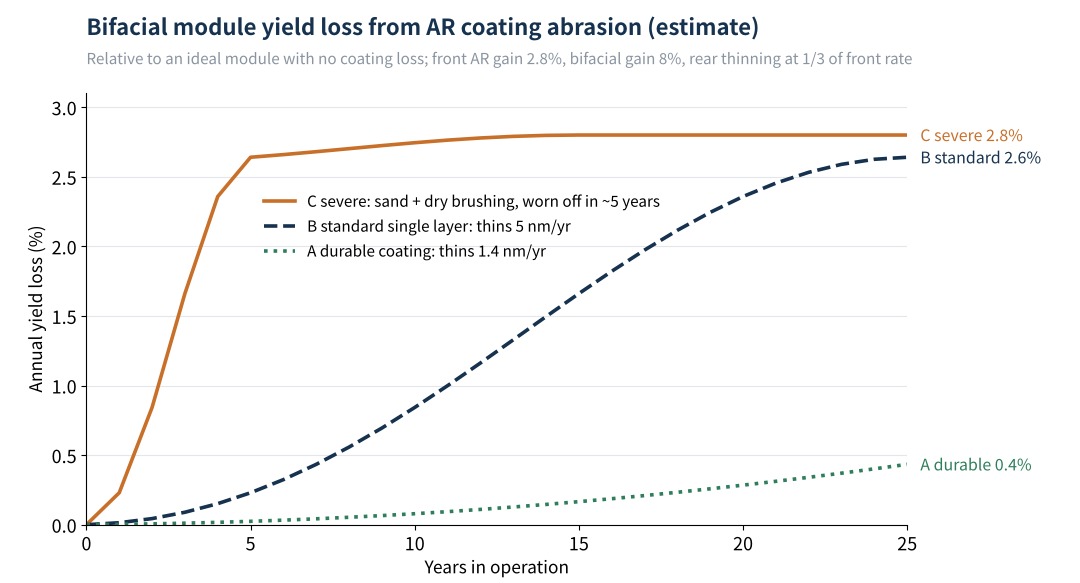
Figure 4 Annual yield loss of bifacial modules under three abrasion scenarios (estimate)
| Scenario | Year 5 loss | Year 10 loss | Year 25 loss | 25-year average loss |
|---|---|---|---|---|
| A durable coating | ≈0.02% | ≈0.08% | ≈0.4% | ≈0.2% |
| B standard single layer | ≈0.2% | ≈0.8% | ≈2.6% | ≈1.3% |
| C severe abrasion | ≈2.6% | ≈2.7% | ≈2.8% | ≈2.5% |
Table 2 Estimated yield loss under the three scenarios
The estimates carry three messages:
- The ceiling is fixed: however severe the wear, the maximum loss from the AR coating equals the gain it originally provided, about 2.5–3%. Only when the glass itself is roughened and becomes hazy can losses exceed this ceiling.
- The difference is "how soon you hit the ceiling": the 25-year average losses of scenarios A and C differ by more than tenfold. For a 1 GW plant, scenario C loses roughly 40 million kWh a year, and the difference comes down to coating abrasion resistance and cleaning strategy.
- The rear is not the main issue: with an 8% bifacial gain, even if the rear coating wears off equally, the effect on total yield is only about 0.2 percentage points; the front coating remains the main factor.
There is also a "hidden cost": porous SiO2 coatings are somewhat hydrophilic and anti-soiling, so once the coating is worn off, the surface may soil more easily, cleaning needs rise, and wear accelerates further, creating a vicious circle of "coating loss, more soiling, more cleaning, more coating loss". DuraMAT has shown a module that lost almost all of its AR coating after 13 years at a high-soiling site, and QEERI's study shows that cleaning frequency itself is a variable that amplifies coating loss.
Sand does not damage AR coatings in the first sandstorm, but through years of combined erosion and dry cleaning; when choosing a coating, look not at initial transmittance but at how much is left after abrasion.
06Final thoughts
For desert projects, we suggest managing AR coating durability at every stage:
- Selection: require suppliers to provide IEC 62788-7-3 falling-sand (SAT03) and brushing (SAT01/02) data, specifying sand type, sand quantity and brush cycles, and the change in transmittance and haze before and after testing.
- Design: pay attention to mounting height and windward sand protection to reduce the impact of saltating sand on the lower edges of modules.
- O&M: adjust cleaning frequency dynamically to actual soiling losses rather than "the more the better"; validate robot brush material and pressure, and where possible run field comparisons of specific "robot plus module" combinations.
- Monitoring: set up regular AR coating inspections using portable reflectance measurement or colour microscopy to track thinning, rather than finding out only after yield has dropped.
The AR coating is the thinnest material layer in a PV module, yet it guards 2–3% of energy yield. In extreme environments like the desert, it deserves to be treated seriously as a reliability metric. Which desert PV topic matters most to you? We would be glad to hear from you.
References
- IEC 62788-7-3:2022 (+AMD1:2024) Measurement procedures for materials used in photovoltaic modules – Part 7-3: Accelerated stress tests – Methods of abrasion of PV module external surfaces.
- Bomber J., Miller D. et al. The IEC 62788-7-3 Abrasion Methods Standard and Supporting Experiments at NREL on PV Surfaces and Coatings. NREL/PR-5K00-82517, 2022.
- DIN 52348:1985 Testing of glass and plastics; abrasion test; sand trickling method.
- Mathiak G. et al. PV Module and Solar Glass Trickling Sand Testing. ISFH, 2018.
- Klimm E. et al. Fraunhofer ISE, 31st EU PVSEC, 2015 (comparison of desert exposure and falling-sand tests).
- Fraunhofer ISE. Abrasion testing of anti-reflective coatings under various conditions, 2022.
- Mathiak G. et al. PV Modules Sand and Brush Abrasion Testing. DEWA R&D, 2023.
- Karin T. et al. Photovoltaic module antireflection coating degradation survey using color microscopy and spectral reflectance. OSTI 1996044.
- Karin T. et al. Non-destructive Characterization of Anti-Reflective Coatings on PV Modules. arXiv:2101.05446.
- DuraMAT. Anti-Reflection Coatings for Photovoltaic Module Glass. duramat.org.
- San Vicente G. et al. Study of abrasion tests for antireflective and antisoiling/antireflective coatings on glass solar tubes. Solar Energy, 2023, 252: 134–144.
- Alami Merrouni A. et al. Experimental analysis of Anti-Reflective coating performance in desert climate. Sustainable Energy Technologies and Assessments (reported by pv magazine, 2024-08-22).
- Figgis B. et al. Abrasion of PV Antireflective Coatings by Robot Cleaning. IEEE Journal of Photovoltaics, 2024, 14(5): 824–829.
- Review of research progress on windblown sand effects on desert PV modules. Acta Aerodynamica Sinica.
- Research progress on anti-reflective coatings for PV glass. Materials Reports (DOI: 10.11896/cldb.18080062).
- JC/T 2170-2013, Anti-reflective coated glass for PV modules.
A PV R&D and technology team with 10+ years of experience | In-depth technical knowledge sharing
Materials · Reliability · Failure Analysis · Standards & Certification · Products · Processes
Exploring AI + PV; collaboration welcome
Disclaimer:
1. Original content reflects the authors' personal views only, is for reference only and does not constitute investment advice.
2. Reposted and cited content is credited to its source, out of respect for original work.
3. Some content was produced with AI assistance (chart generation, data retrieval, concept explanations, etc.); the core framework and key content were written by our technical team and reviewed by people.
4. If anything is inaccurate or infringes your rights, please leave a message or contact us and we will deal with it.