
Same UV Test, Very Different UVID Results: Why? A New Fraunhofer Paper Explains
In brief
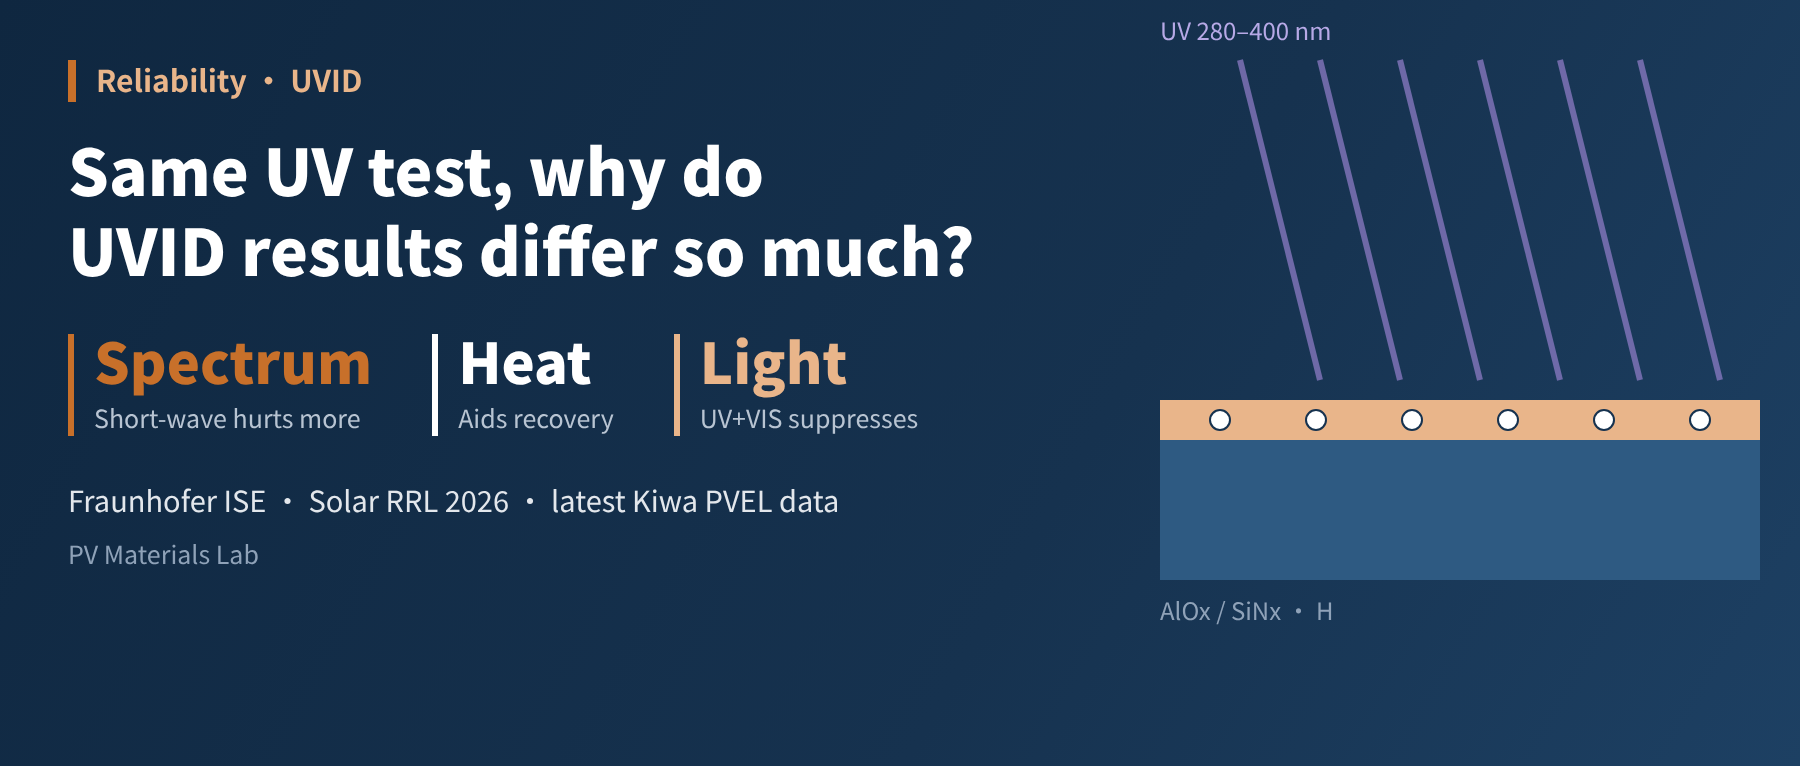
A Fraunhofer ISE team has published a study of accelerated UV testing in Solar RRL: short-wave UV worsens near-surface defects, higher temperature suppresses degradation, defect generation is roughly proportional to UV dose but net degradation depends on the thermal budget, and UVID almost disappears under simultaneous UV and visible light. We unpack the four findings and, with Kiwa PVEL's latest data on 370 modules, look at what they mean for UV testing, reading test reports and cell design.
In mid-October, a Fraunhofer ISE team published a paper in Solar RRL on accelerated testing for ultraviolet-induced degradation (UVID). It launches no new cell and reports no startling degradation figures, but it answers a question that troubles test engineers and buyers alike: why does UVID measured on the same kind of module differ so much between laboratories and UV tests?
01What the news says
The team (Pascal Messmer et al., from Fraunhofer ISE and the University of Freiburg's INATECH, among others) studied unencapsulated industrial TOPCon and HJT cells and systematically varied four parameters: the shape of the UV spectrum, UV intensity, cell temperature during exposure, and whether visible light (VIS) was applied at the same time. They also used ToF-SIMS (time-of-flight secondary ion mass spectrometry) to observe hydrogen redistribution near the passivation layers, linking changes in electrical performance to microscopic mechanisms.
Some background first. UVID has become an unavoidable reliability topic for n-type cells over the past two years: since 2024, several third-party laboratories have reported significant power loss in some TOPCon and HJT modules after UV testing. The prevailing explanation is that UV photons break Si–H bonds in the front passivation layer; hydrogen migrates and redistributes, interface defects increase, surface recombination rises, and open-circuit voltage and efficiency fall. Research at UNSW has also shown that TOPCon degradation occurs mainly at the front surface, while the rear is relatively stable because the doped polysilicon absorbs short-wave UV.
The debate has always been whether, and how much, the degradation measured in the lab actually occurs outdoors. This paper takes that question head on.
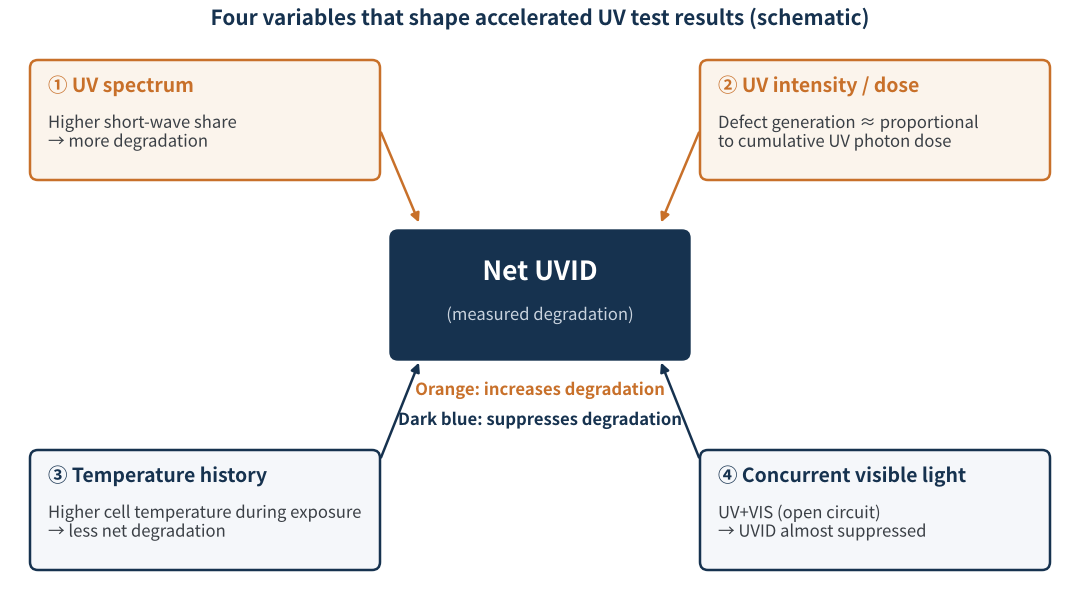
Figure 1 Four variables that shape accelerated UV test results (schematic)
02Four findings, one by one
- Short-wave UV does more damage. The shorter the wavelength and the higher the photon energy, the stronger the UVID, with damage concentrated near the surface. This is consistent with earlier UNSW findings that UV-B can cause the same kind of degradation faster.
- Higher temperature means less degradation. The higher the cell temperature during exposure, the milder the degradation. This runs against the common intuition that "heat accelerates ageing", and suggests that temperature acts more as a "repairer" here.
- Defect generation follows dose; net degradation follows thermal budget. At a fixed exposure time, the number of defects generated is roughly proportional to the cumulative UV photon dose, but the net degradation finally measured depends critically on the cumulative thermal budget (the history of temperature and time).
- Add visible light and UVID almost vanishes. Under near-outdoor conditions of simultaneous UV and visible light at open circuit, UVID was almost completely suppressed. The authors attribute this to continuous injection of photogenerated carriers promoting repassivation.
There is also an easily overlooked effect: TOPCon cells stored in the dark after UV exposure show additional metastable degradation, which, like the initial UVID, can be reversed by visible light soaking at elevated temperature.
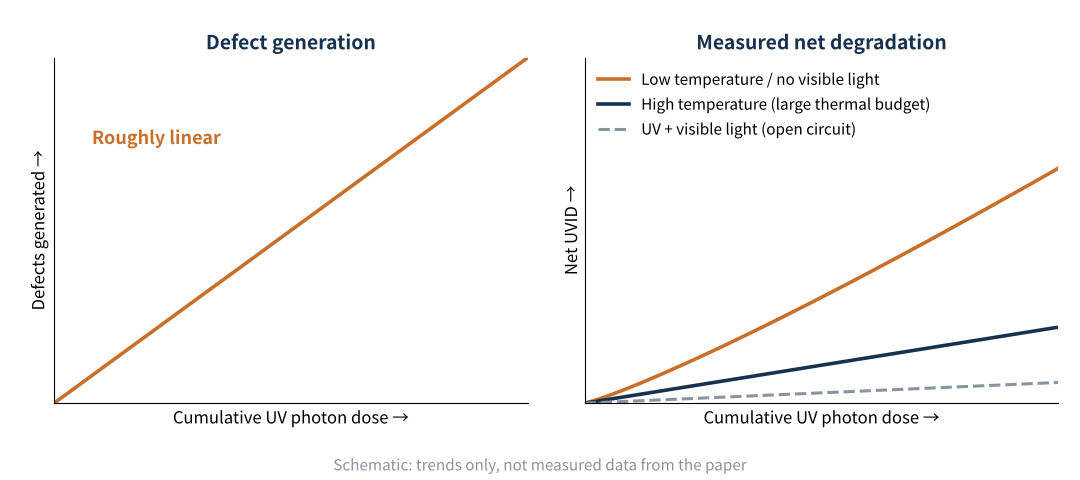
Figure 2 Relationship between defect generation and net degradation (schematic, not measured data)
UVID is not a number set by UV dose alone. It is a dynamic balance between "UV creating defects" and "heat and light promoting repair", and what you measure is the difference between the two.
03What this means for UV testing
Take the UV preconditioning test (MQT 10) in IEC 61215-2: UV in the 280–400 nm band, a dose of 15 kWh/m², module temperature controlled at 60 ± 5 °C, and no requirement for simultaneous visible light. Extended industry tests (often called UV60, UV120 and so on) usually increase the dose on this basis, and laboratories differ in lamp spectrum, temperature and pre-measurement handling.
Apply the paper's findings and it becomes clear why UVID figures in different reports often fail to match:
| Variable | Typical accelerated UV test | Real outdoor conditions | Effect on measured UVID |
|---|---|---|---|
| UV spectrum | Lamp spectrum; short-wave share may be high | Solar spectrum; low short-wave UV share | More short-wave, more degradation |
| Temperature | Set by the test; varies between labs | Varies with sunlight and season | Higher thermal budget, less net degradation |
| Visible light | Usually absent or weak | UV and visible light arrive together | Visible light significantly suppresses degradation |
| Pre-measurement handling | Dark storage time and light soaking vary | Daytime light, night-time dark cycles | Dark storage can add metastable loss; light soaking can recover it |
Table 1 Differences between accelerated UV tests and outdoor conditions
This also explains an observation from third-party labs: in its UVID presentation at EU PVSEC 2026 in September, Kiwa PVEL stated that for UVID-sensitive samples, a full-spectrum light soak after UV exposure is essential for representative results. Its practice is to add a 0.5–1 kWh/m² light soak if more than 48 hours have passed since the end of UV120 before measurement. The Fraunhofer paper effectively provides the mechanistic basis for this practice.
That said, there are some limits to bear in mind. The samples were unencapsulated cells, and in real modules glass and encapsulant change the UV spectrum reaching the cells. "Almost complete suppression" was observed at open circuit, whereas outdoor modules operate at the maximum power point, where carrier concentration in the cell is lower than at open circuit, so the suppression may be weaker. And the public abstract gives no specific degradation values, doses or temperature set points.
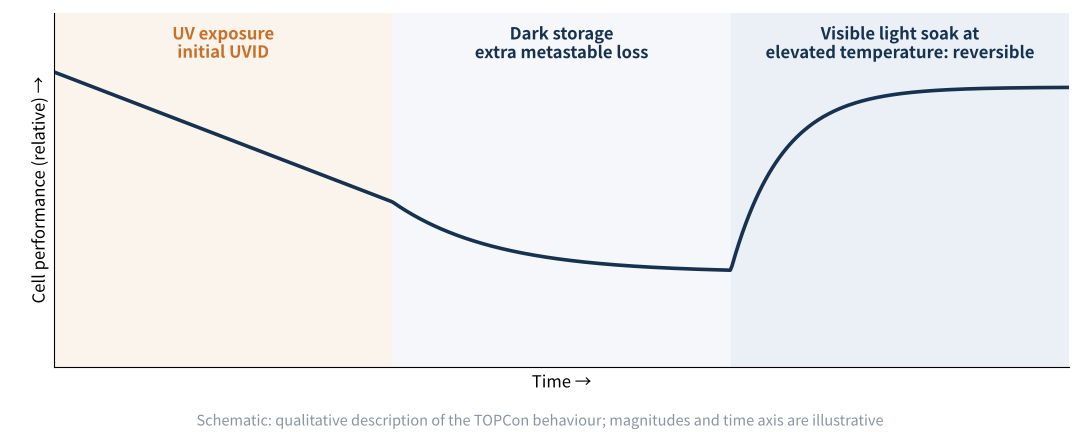
Figure 3 Post-UV dark-storage degradation and light-soak recovery in TOPCon (schematic)
04What outdoor and third-party data say
Read alongside other data from recent months, this paper leads to a more complete, and more measured, conclusion.
At EU PVSEC 2026, Kiwa PVEL and the Netherlands' NLR presented results for 370 industrial modules tested in 2024–2026 (78% of them TOPCon) after UV120 (120 kWh/m²):
| Technology | Degradation range after UV120 | Median | Main characteristics |
|---|---|---|---|
| TOPCon | 0.4%–16.6% | 3.0% | Mainly Voc loss; recovers quickly from dark storage |
| HJT (limited sample) | 1.5%–8.6% | 5.2% | Mainly Isc and FF loss; slower recovery |
| PERC | — | 2.1% | Lower degradation; no metastability |
Table 2 Kiwa PVEL UV120 test results (EU PVSEC 2026)
Several points are worth reading against Fraunhofer's conclusions:
- Degradation happens outdoors too. Modules exposed outdoors for one year by Kiwa PVEL in Davis, California, showed a median Pmax loss of 2.2%, mainly in Voc, with the same checkerboard EL pattern as indoors; most of the field-exposed bills of materials would not meet a "<1% first-year degradation" warranty. NREL research published in February likewise found 2.3–3.2% of non-recoverable loss after a UV dose equivalent to about one year outdoors.
- Light soaking recovers the dark-storage part, not everything. Kiwa PVEL states explicitly that degradation from dark storage can be recovered by a full-spectrum light soak, but the UV-induced damage itself is not recovered; dark-storage metastability can reach about 1% per day, and one sample reached a total loss of 12.3% after dark storage.
- Material choices matter. Encapsulants with UV cut-offs below 300 nm were associated with higher degradation, and encapsulant additives and stabilisers can cause problems such as yellowing; one TOPCon bill of materials improved from 6.5% to 1.3% degradation on retest. Kiwa PVEL's conclusion: UVID stability is improving, but it is not solved yet.
Standards are catching up too: IEC TS 63624-1 (UV-induced degradation test method for crystalline silicon modules) entered stage 50.20 (final ballot) on 2 October, and a Trina Solar team's paper published in October proposes splitting UVID into reversible r-UVID and irreversible ir-UVID, aligned with that standard's recovery procedure.
Fraunhofer explains why labs may "over-measure"; outdoor data from Kiwa PVEL and NREL show that "over-measured" does not mean "absent". What remains after recovery is the degradation that really needs managing.
05Suggestions for different roles
- Readers of test reports (buyers, owners, insurers): look at the test conditions first, then the degradation figure. Without the spectrum, dose, temperature, interval between UV and measurement, and whether a light soak was applied, a UVID figure is only half a sentence.
- Test and certification laboratories: fully record the spectral distribution, temperature history and pre-measurement handling in reports; consider reporting two values, "measured directly after UV" and "measured after light soaking", corresponding respectively to a conservative case and a state closer to outdoor stabilisation. Kiwa PVEL also notes that sensitivity varies between cells within the same module, so testing only a few cells is not enough; cover multiple cells and multiple batches.
- Cell and module R&D: do not relax UV stability because "it may recover outdoors". Hydrogen management in the passivation stack (such as AlOx thickness and SiNx hydrogen content) and process control of the front anti-reflection and passivation layers remain fundamental. On the packaging side, UV-cut or down-converting encapsulants can reduce the short-wave UV reaching the cells, but cut-off wavelengths and additives need validation.
- Quality and failure analysis: if field EL or IV measurements are taken after long periods in the dark, they may include a metastable component; when diagnosing UVID, pay attention to measurement timing and the sample's light history.
06Final thoughts
The value of this paper lies not in telling everyone that "UVID is not serious", but in reminding the industry that every parameter of an accelerated test changes the conclusion. We do not recommend reading "almost complete suppression under UV+VIS" as "there will be no UVID outdoors"; Kiwa PVEL's one-year outdoor median loss of 2.2% is a counter-example. The more realistic path is to write spectrum, temperature, visible light and pre-measurement handling into UV test procedures so that data from different laboratories and batches become truly comparable, and to assess long-term risk by the degradation remaining after recovery.
Once the full paper is available, we will add the key figures such as spectral cut-off wavelengths, doses and temperature set points. If you have run UV tests yourself, what have your results shown? We would be glad to hear from you.
How much UVID you measure depends on how you illuminate: with a UV report, read the conditions before the numbers; for outdoor risk, look at what remains after recovery.
References
- Messmer P., et al. Solar RRL, 2026. DOI: 10.1002/solr.70516
- pv magazine. New research warns of unexpected UV-induced degradation in TOPCon solar cells from invisible light (UNSW, SOLMAT), 2025-08-11
- pv magazine. Fraunhofer ISE warns of risk from higher than expected UV-induced degradation in TOPCon, PERC, HJT cells (Solar RRL), 2024-12-02
- Kiwa PVEL & NLR. UV-Induced Degradation in TOPCon and Other Modules, EU PVSEC 2026, 2026-09-14
- IEC 61215-2:2021, MQT 10 UV preconditioning test
- pv magazine USA. Solving the UV problem of n-type solar, 2024-10-21
- pv magazine USA. NREL researchers quantify UV-induced degradation levels in TOPCon solar cells, 2026-02-18
- Fraunhofer ISE / CSP. UV-induced degradation: comparative analysis of PV module testing and stabilization procedures against outdoor behavior. EPJ Photovoltaics, 2026, 17: 15
- pv magazine. Trina Solar researchers propose new classification of ultraviolet-induced degradation in TOPCon solar cells, 2026-10-14; IEC TS 63624-1 project information (ISS project page)
A PV R&D and technology team with 10+ years of experience | In-depth technical knowledge sharing
Materials · Reliability · Failure Analysis · Standards & Certification · Products · Processes
Exploring AI + PV; collaboration welcome
Disclaimer:
1. Original content reflects the authors' personal views only, is for reference only and does not constitute investment advice.
2. Reposted and cited content is credited to its source, out of respect for original work.
3. Some content was produced with AI assistance (chart generation, data retrieval, concept explanations, etc.); the core framework and key content were written by our technical team and reviewed by people.
4. If anything is inaccurate or infringes your rights, please leave a message or contact us and we will deal with it.