
China's Wind and Solar Pass 2 TW: The Next Phase of PV Is About Reliability
INFO
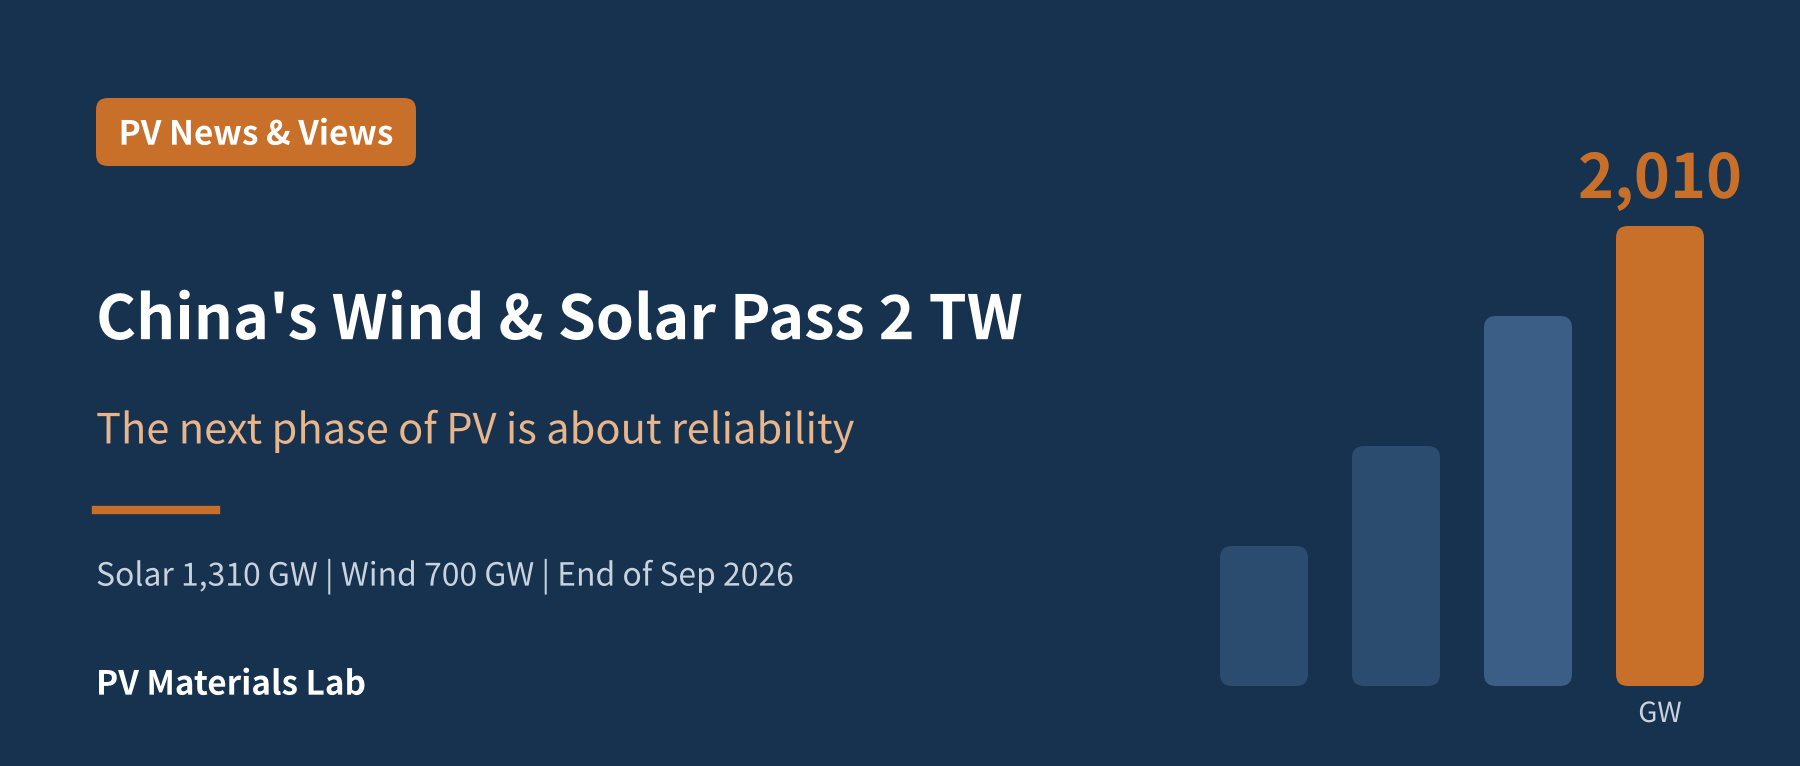
On October 26, China's National Energy Administration (NEA) announced that by the end of September 2026, cumulative wind and solar capacity had reached 2.01 TW (2,010 GW), officially crossing the 2 TW mark. Solar accounted for 1.31 TW (+16.5% year on year) and wind for 0.70 TW (+20.4%).
The headline number is impressive, but we want to look at three details behind it — they matter more to PV professionals than the milestone itself.
01 The News: What the Numbers Say
Here are the key figures from the NEA release:
| Indicator | Value | Note |
|---|---|---|
| Cumulative wind + solar capacity | 2.01 TW | End of Sep 2026 |
| — Solar | 1.31 TW | +16.5% YoY |
| — Wind | 0.70 TW | +20.4% YoY |
| Wind + solar added, Jan–Sep | ~170 GW | — |
| Wind + solar generation, Jan–Sep | 1,933.3 TWh | +193.7 TWh YoY |
| Share of new electricity demand met by wind + solar | 64% | Jan–Sep |
| Midday wind + solar output on summer peak-load day | >40% of load | Midday |
| Wind + solar share of energy-sector investment | ~one third | Jan–Sep |
Table 1 Key points of the NEA release, Oct 26, 2026
The NEA describes renewables as the main driver of the energy transition, a key pillar of energy security and a major engine of energy investment. An expert from the China Electricity Council (CEC) said the milestone further consolidates renewables' leading position in China's power capacity mix.
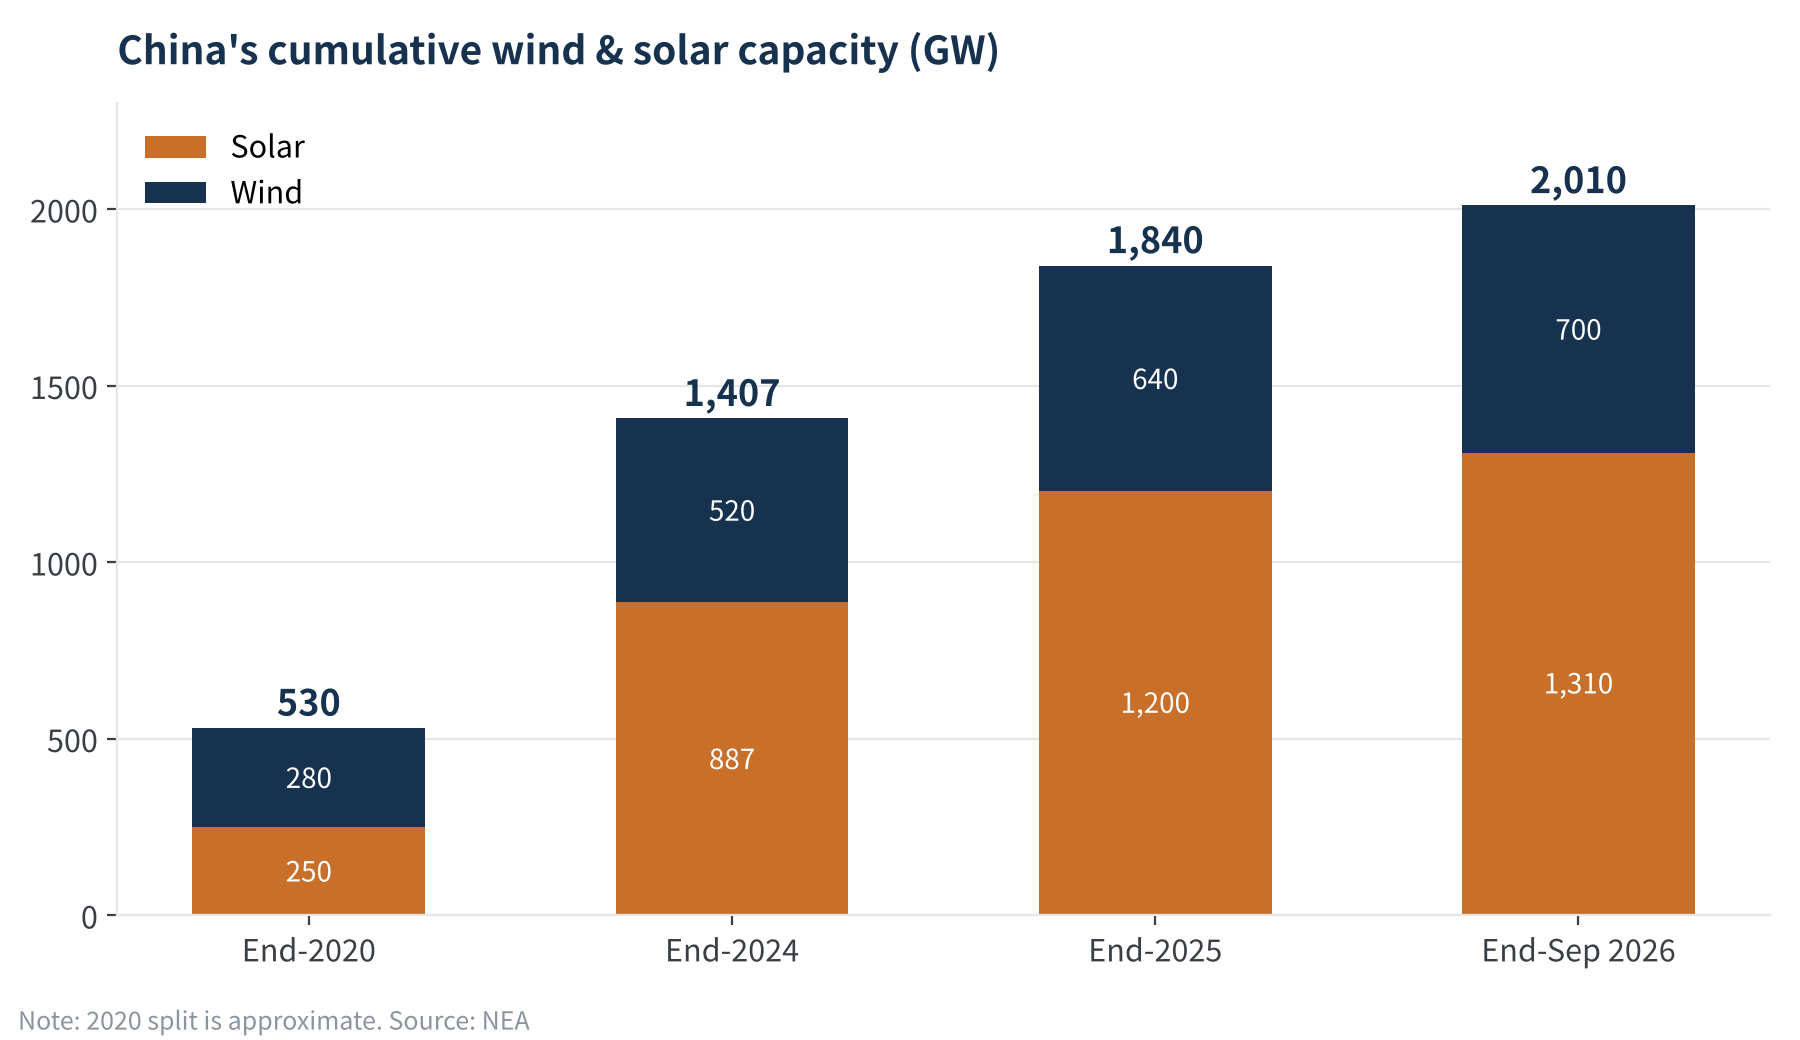
The longer view is striking: wind and solar stood at about 530 GW at the end of 2020, reached 1.84 TW at the end of 2025, and passed 2 TW less than a year later. According to an NEA meeting in early October, solar capacity had already overtaken coal power by the end of August, becoming the largest power source by installed capacity in China.
02 Detail One: Solar Is Now the Slowest-Growing
Solar grew 16.5% year on year, wind 20.4% — solar growing slower than wind has been rare in recent years.
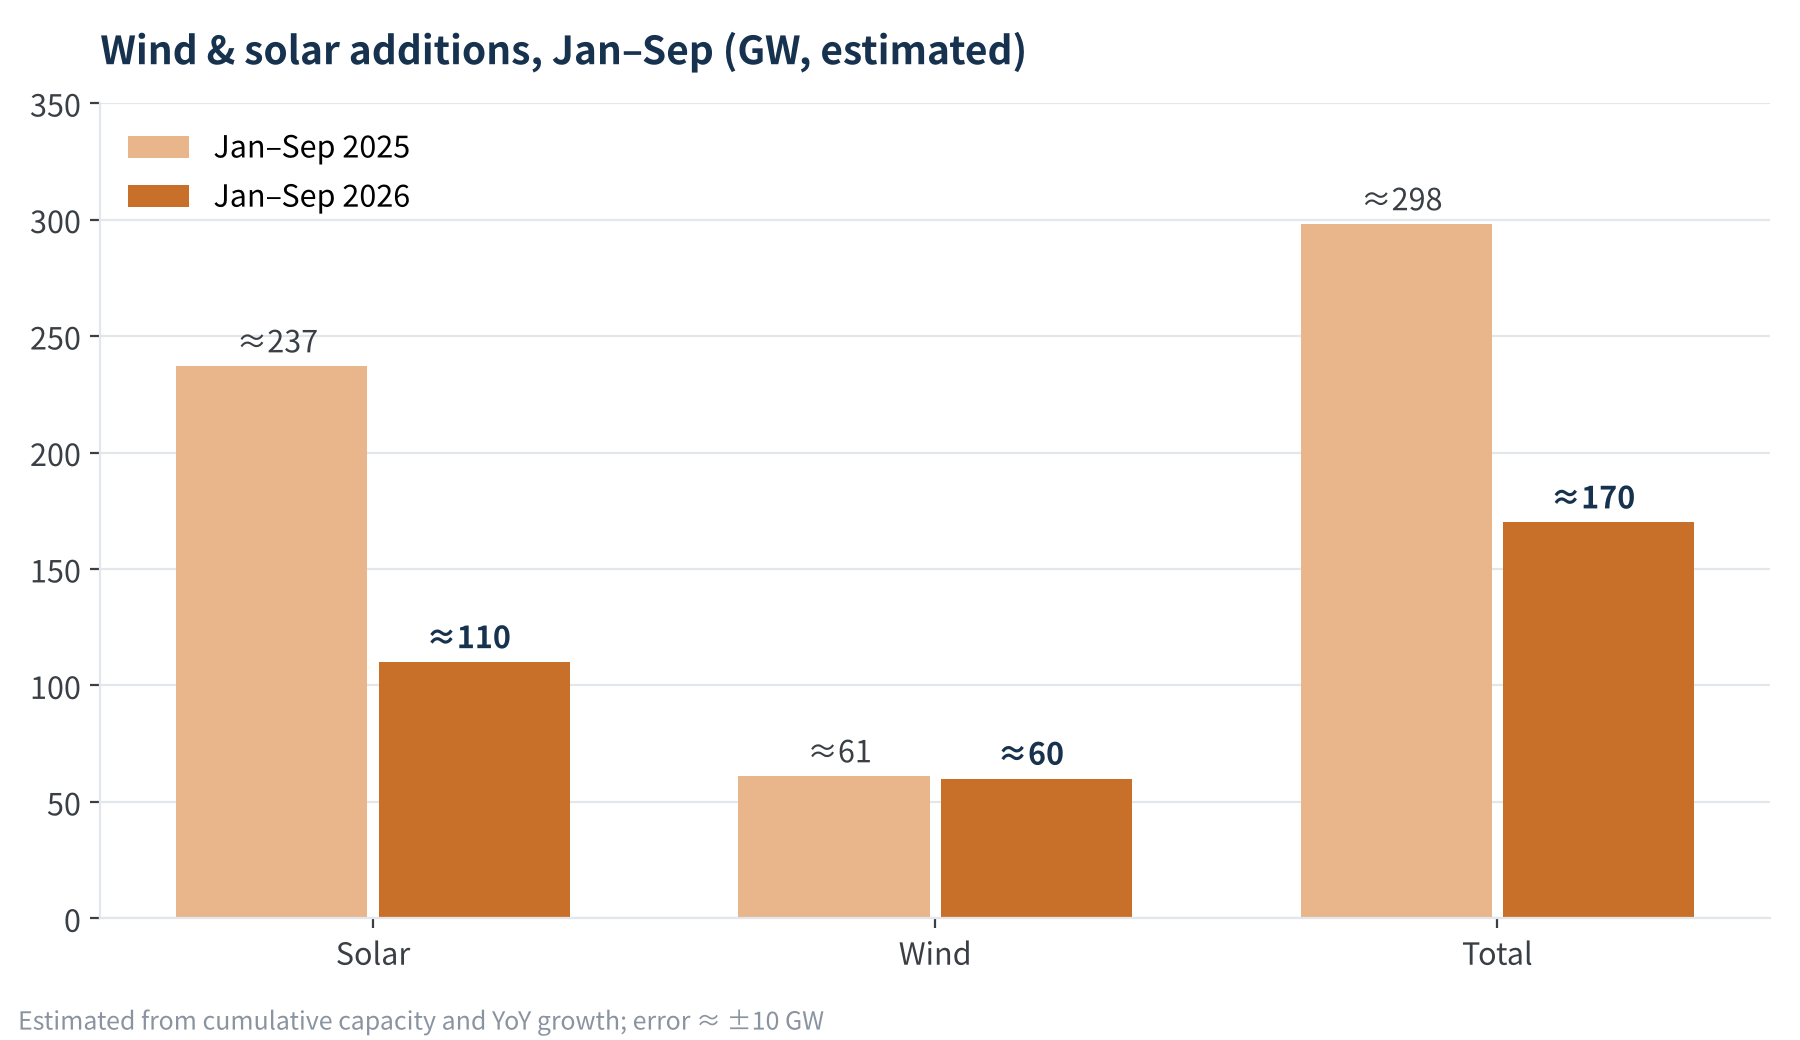
Looking at additions makes it clearer. Solar capacity was 1.20 TW at the end of 2025 and 1.31 TW at the end of September 2026, implying roughly 110 GW of new solar in the first three quarters, versus roughly 240 GW in the same period of 2025 (see calculation notes). New additions have roughly halved. TaiyangNews data for January–July likewise show China's new PV installations down about 60% year on year.
The reasons are straightforward:
- A base inflated by the 2025 rush: From June 2025, China moved new renewable projects to market-based pricing (the "Document No. 136" cutoff). May 2025 saw a one-month rush of over 90 GW, making 2026's year-on-year comparison look especially weak.
- The return model has changed: New projects now sell power through the market. Solar output is concentrated at midday, when prices are easily pushed down, so investors have become more cautious; wind auction results have been comparatively steady.
Takeaway
Cumulative solar capacity is still growing, but the era of record additions every year is over. The industry is shifting from competing on volume to competing on project returns and generation quality.
03 Detail Two: Capacity ≠ Generation
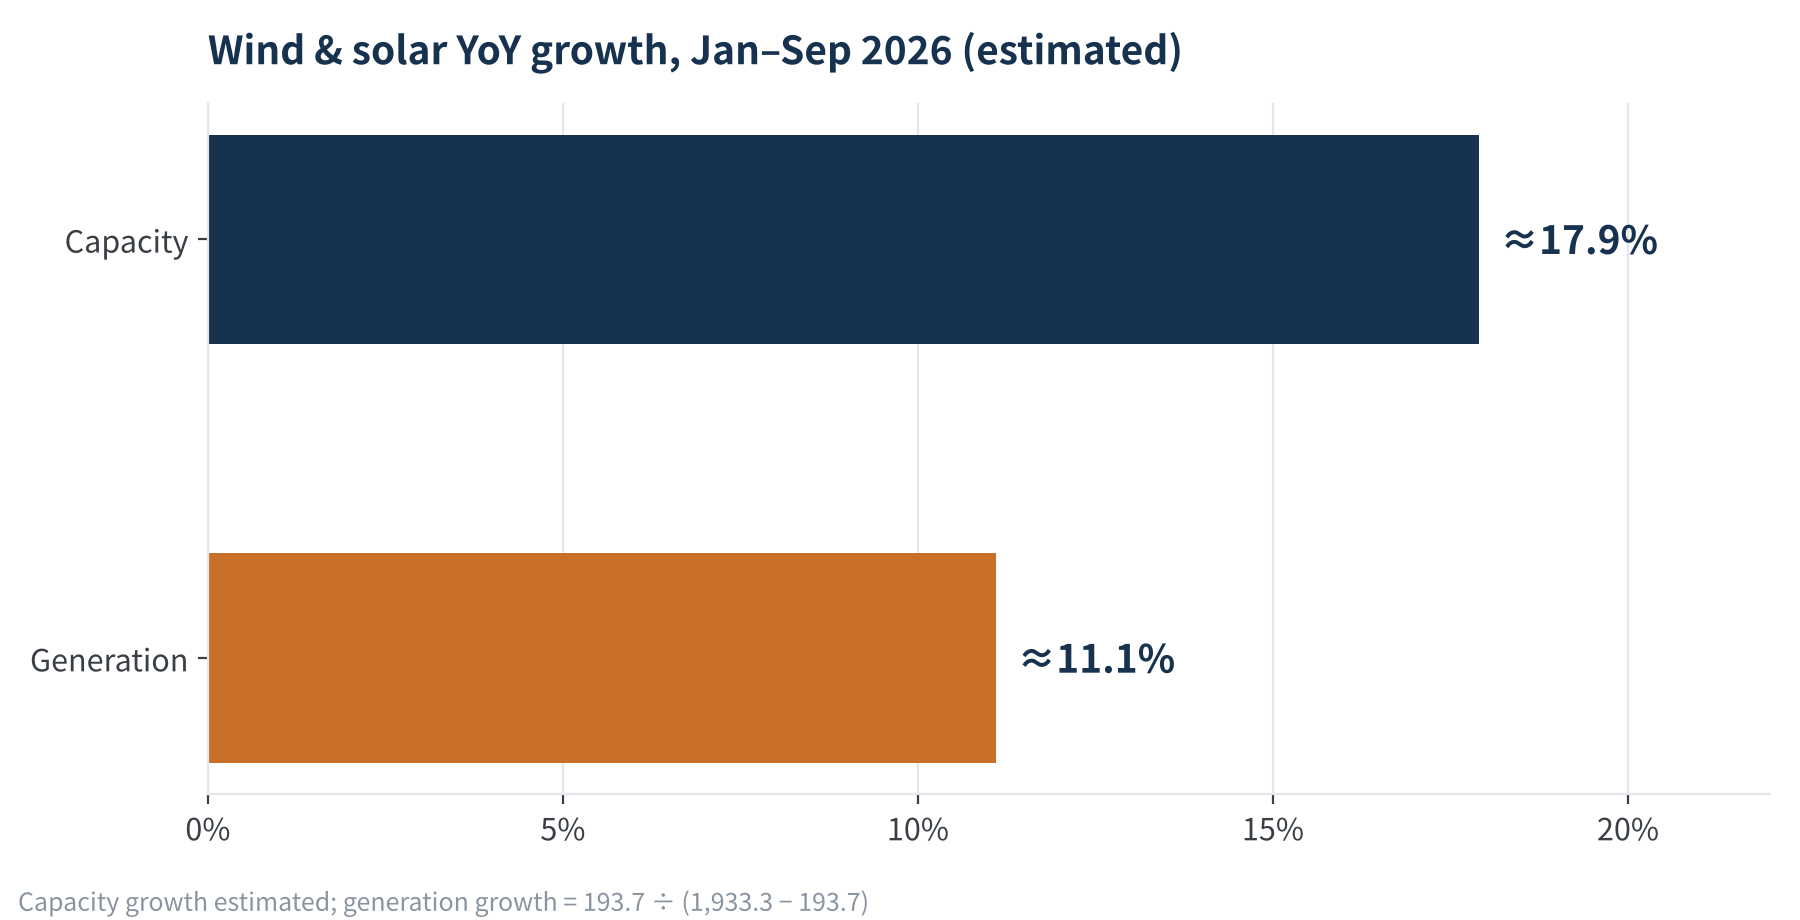
Wind and solar generated 1,933.3 TWh in January–September, 193.7 TWh more than a year earlier — growth of about 11.1%. Over the same period, installed capacity grew about 17.9% (estimated). Generation growth lagged capacity growth by nearly 7 percentage points.
Several factors combine to create the gap:
- Different measurement bases: Capacity is measured at a point in time; generation accumulates over a period. Projects connected during the year contribute only part of a year's output, so a gap is natural during rapid build-out.
- Grid absorption limits: China's national PV utilization rate in Q1 2026 was 90.6%, meaning close to a tenth of potential PV output was curtailed. Concentrated midday output and limited local grid capacity are the main causes.
- Resource variability: Year-to-year changes in wind speed and irradiance alone can move output by several percentage points.
There is a positive side: 64% of China's new electricity demand in January–September was met by wind and solar. Renewables are now the main source of incremental power. The question is no longer whether they exist, but whether they can be used — and used well.
04 Detail Three: From "More Capacity" to "Dependable Capacity"
In our view, the second half of the Xinhua report is the part most worth reading closely.
The 15th Five-Year Plan for Renewable Energy Development, released earlier this year, sets reliable substitution targets for the first time. These include the average capacity credit of wind and solar, new reliable peak-supply capability from renewables, and the share of wind and solar in evening-peak electricity during summer and winter peaks. The plan calls for more than 300 GW of new reliable peak-supply capability during 2026–2030. (Note: this is background from a plan already issued, not a new document.)
What is "capacity credit"? Put simply, it is how much output a power source can be counted on to deliver when the grid is under the most stress.
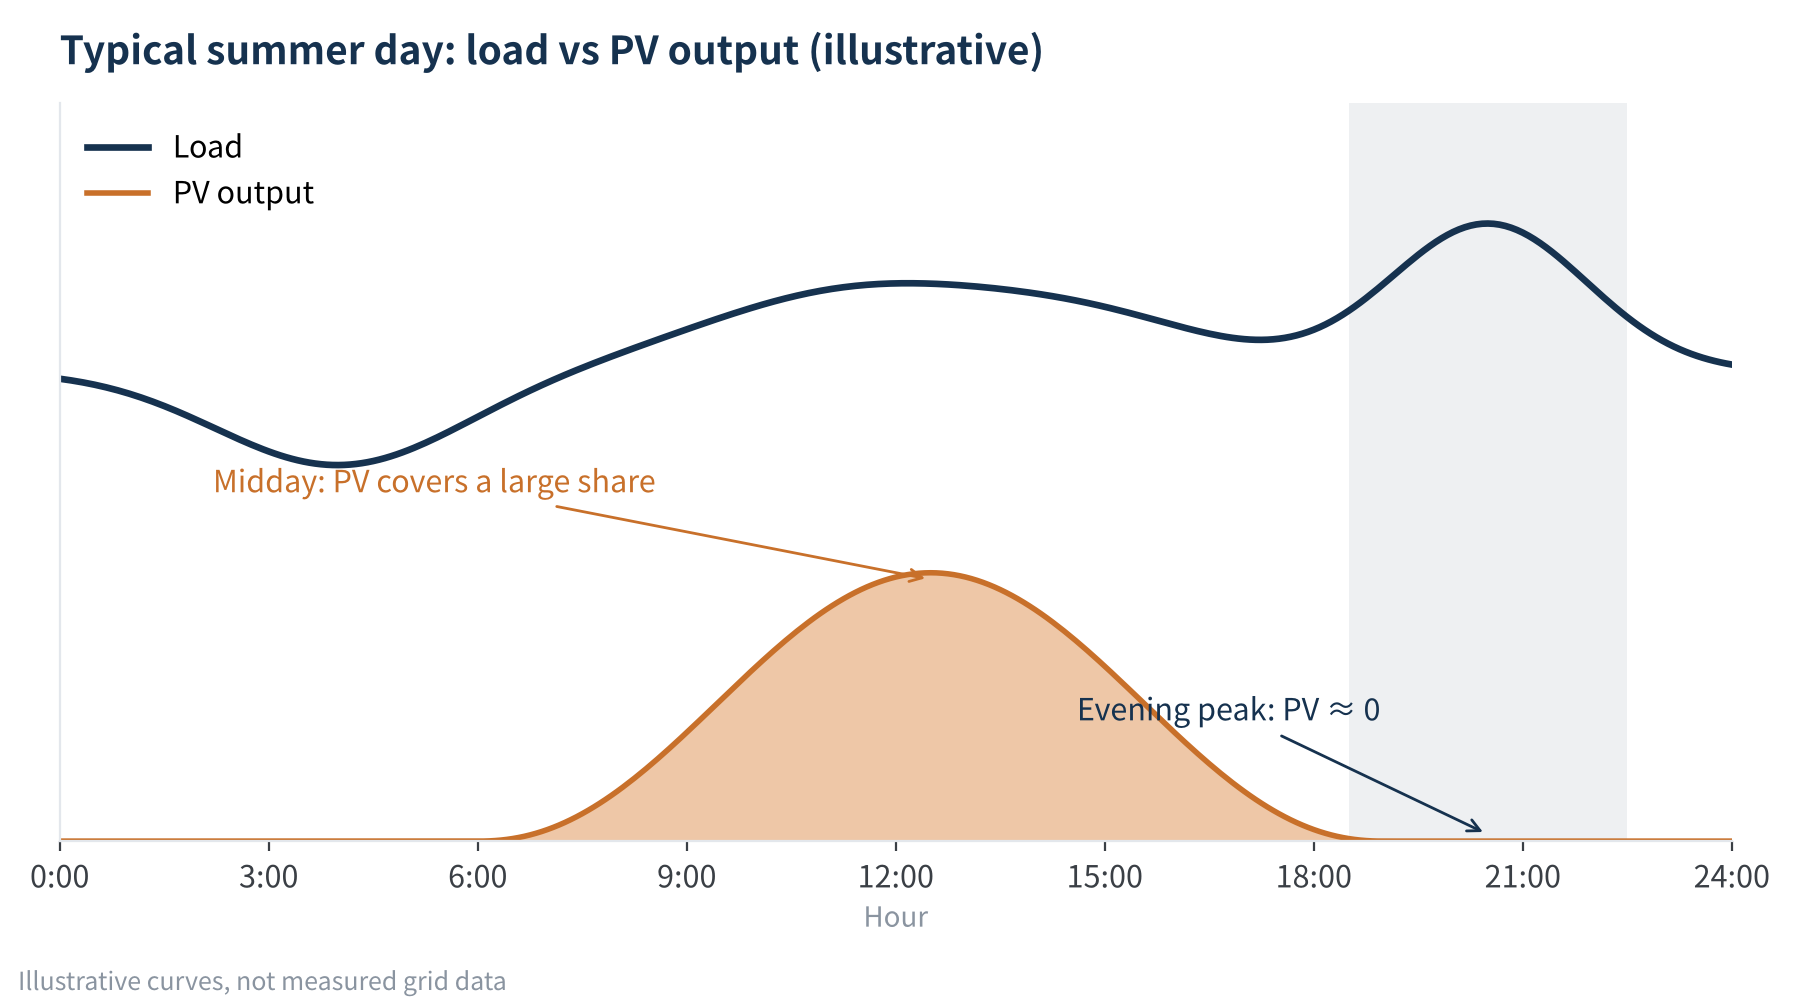
This is exactly where PV is weakest. On this summer's peak-load day, midday wind and solar output exceeded 40% of load — a remarkable performance. But the evening peak usually runs from late afternoon into the night, when PV output falls to nearly zero. On its own, PV's evening-peak capacity credit is close to zero.
Making renewables dependable is a system-level task: new-type energy storage (136 GW / 351 GWh in operation at the end of 2025, average duration 2.58 hours), flexible generation, power-market mechanisms, and "grid-friendly" plants with grid-forming and frequency-support capability.
Bottom line
2 TW is a milestone of quantity. The real test of the 15th Five-Year Plan period is quality — above all, how much renewables can deliver at the evening peak.
05 Our View: What It Means for Modules and the Supply Chain
As a technical team working on materials, modules and reliability, we care most about how these numbers flow through to products:
- From nameplate power to lifetime energy: Under market pricing, plant revenue is roughly energy times price. First-year degradation, annual degradation, bifaciality, temperature coefficient and low-light performance all translate directly into revenue; nameplate power is no longer the only selling point.
- Morning and evening power is worth more than midday power: With midday surpluses pushing prices down, generation in the shoulder hours is more valuable. East–west layouts, vertical bifacial systems and trackers deserve a fresh look under the new pricing regime.
- PV-plus-storage moves from add-on to default: Reliable peak-supply targets will push storage from mandatory add-on toward active revenue participation. For module makers, system-level solution capability will matter more and more.
- Reliability issues in the installed base will surface: Of the 1.31 TW installed, early-generation modules are entering mid-to-late life. PID, microcracks, backsheet cracking and ribbon corrosion will appear more often. As new additions slow, quality and O&M of existing plants become a new front line for the PV industry.
Final Thoughts
Passing 2 TW is worth celebrating, but for PV professionals this news is more of a reminder: the first half of the game — scale expansion — is nearing its end. The second half is about energy yield, reliability and returns.
Under China's new Nationally Determined Contribution, wind and solar capacity should reach more than 3.6 TW by 2035. Starting from 2.01 TW, that means about 1.6 TW more over roughly nine years, or about 170 GW per year. Volumes will keep growing, but the market will be more selective — about power prices, grid absorption and product reliability.
In upcoming articles we will dig into capacity credit and how module degradation and reliability affect lifetime energy yield. We welcome your thoughts in the comments.
Calculation notes / data basis
- Jan–Sep 2026 additions: solar ≈ 1.31 − 1.20 ≈ 0.11 TW; wind ≈ 0.70 − 0.64 ≈ 0.06 TW; total consistent with the official ~170 GW (end-2025: solar 1.20 TW, wind 0.64 TW).
- End-Sep 2025 capacity back-calculated from YoY growth: solar ≈ 1.31 ÷ 1.165 ≈ 1.124 TW; wind ≈ 0.70 ÷ 1.204 ≈ 0.581 TW. Jan–Sep 2025 additions: solar ≈ 1.124 − 0.887 ≈ 0.237 TW; wind ≈ 0.581 − 0.52 ≈ 0.061 TW (end-2024: solar 0.887 TW, wind 0.52 TW).
- Wind + solar capacity growth ≈ 2.01 ÷ (1.124 + 0.581) − 1 ≈ 17.9%; generation growth ≈ 193.7 ÷ (1,933.3 − 193.7) ≈ 11.1%.
- Official figures are rounded to 0.01 TW, so these estimates carry an error of about ±10 GW and are for trend observation only. Figure 4 is an illustrative curve, not measured data from any grid.
References
- National Energy Administration: China's cumulative wind and solar capacity exceeds 2 TW, 2026-10-26
- Xinhua: China's cumulative wind and solar capacity exceeds 2 TW, 2026-10-26
- China News Service: report on NEA wind and solar capacity, 2026-10-26
- China Daily: China's grid-connected wind and solar capacity exceeds 1.8 TW for the first time, 2026-01-28
- The Paper: China's 2025 renewable generation exceeds EU-27 electricity consumption, 2026-01-30
- Jiemian: 2024–2025 wind and solar capacity data, 2026
- People's Finance: NEA monthly (September) renewable development dispatch meeting, 2026-10-08
- Gelonghui: NEA Q1 2026 PV construction data, 2026-04-27
- TaiyangNews: China Solar PV Installations Recover To 14.08 GW In July 2026
- Xinhua / Economic Information Daily: China's wind and solar capacity reaches 1.73 TW by end of October, 2025-11-25
PV Materials Lab
PV Materials Lab
A PV R&D and technology team with 10+ years of experience | In-depth technical knowledge
Materials · Reliability · Failure Analysis · Standards & Certification · Products · Processes
Exploring AI + PV — collaboration welcome
Disclaimer:
- Original content reflects the authors' personal views, is for reference only, and is not investment advice.
- Reposted and cited content is credited to its source, with respect for original work.
- Some content is AI-assisted (chart generation, data retrieval, concept explanations, etc.); the core framework and key content are written by our technical team and reviewed by humans.
- If anything is inaccurate or infringing, please leave a comment or contact us.