
Reading a Flux TDS/COA: Behind Every Indicator Is a Production-Line Problem
In brief
A flux data sheet is full of solids content, acid value, specific gravity, halogens, copper mirror and SIR — which ones deserve attention? This article sorts the key flux indicators into three groups: physical-chemical indicators that tell you whether it is consistent, soldering performance indicators that tell you whether it will solder, and corrosion and reliability indicators that tell you whether it is safe to leave behind. We explain what each means and how high or low values show up on the production line, use a simple estimate to show why watching specific gravity alone is not enough for low-solids flux, and finally discuss indicators that PV data sheets often omit but that matter more. This is the third article in our PV soldering flux series.
The first two articles covered what flux does and what it is made of. In daily work, though, what people face most is a sheet of paper: the supplier's technical data and the inspection report that comes with each batch, listing anywhere from seven or eight to more than a dozen indicators. This article reads that sheet closely: what each indicator means, and what problem a high or low value turns into on the line.
01First, tell the three documents apart: TDS, COA, SDS
Before looking at indicators, know which document you are holding. The three serve different purposes, and the same indicator means different things in each.
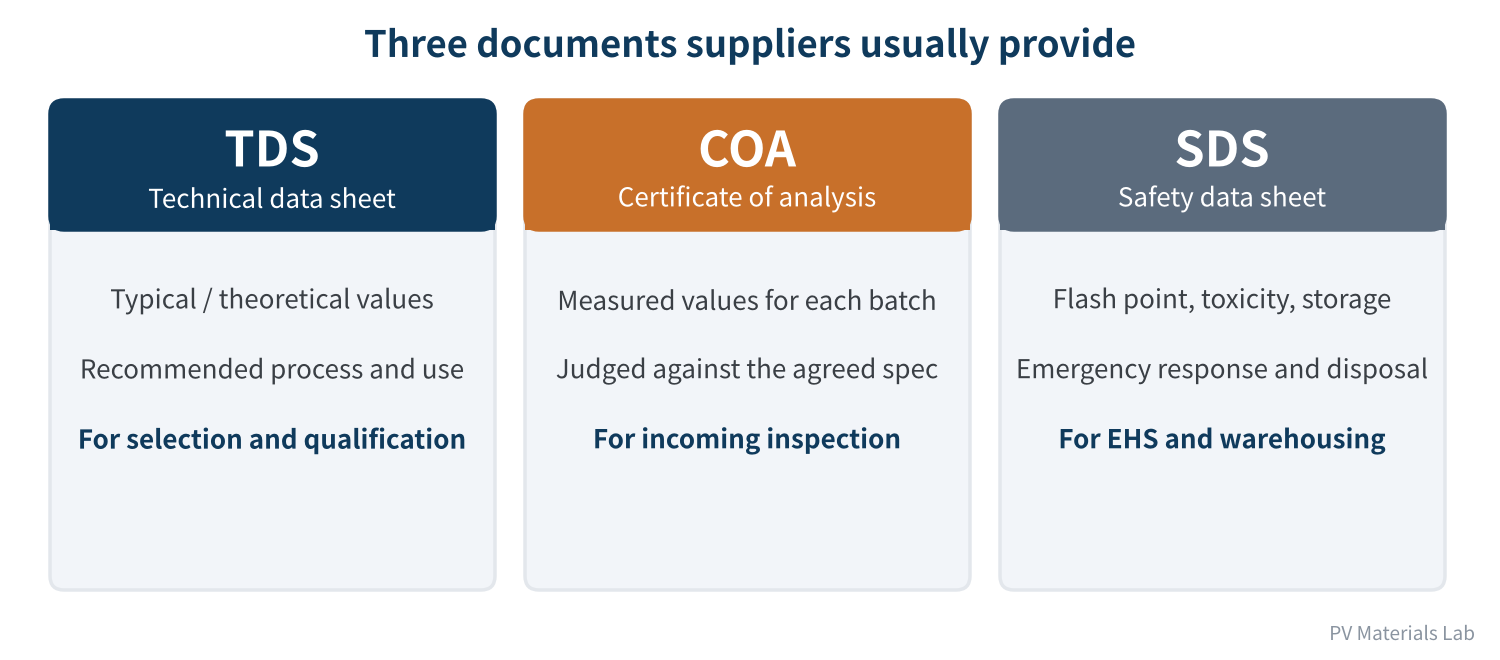
Figure 1 The three documents suppliers usually provide
- TDS (technical data sheet): describes the "typical" or "theoretical" values of a model and the recommended process. It answers "roughly what is this product like", and is used during selection and qualification.
- COA (certificate of analysis): describes the measured values of a specific batch and judges them against a specification. It answers "is this drum the same as the last one", and is the basis for incoming inspection.
- SDS (safety data sheet): covers flash point, toxicity, storage, transport and emergency response, mainly for warehousing and EHS teams.
A common mistake is to use TDS typical values directly as incoming acceptance criteria. TDS numbers describe "what it looks like", not "how far it may deviate". During qualification, the module maker and supplier should turn key indicators into specifications with upper and lower limits and write them into the technical agreement; only then does the COA have a basis for judgement.
02Group 1: physical-chemical indicators — is it consistent?
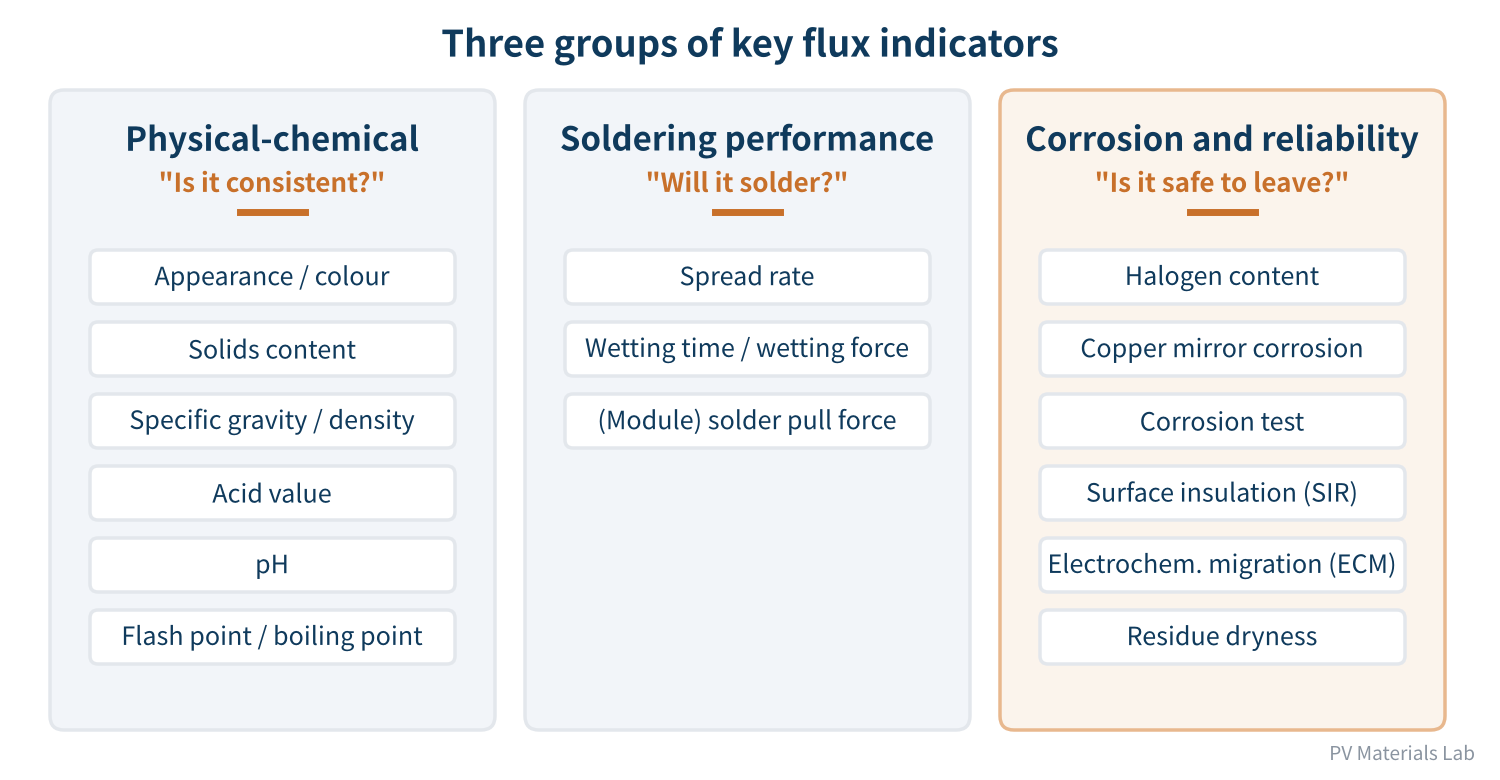
Figure 2 Three groups of key flux indicators
Physical-chemical indicators are quick and cheap to measure and are mainly used to judge batch-to-batch consistency and whether the flux has "gone off" in use.
- Appearance / colour: acceptable PV flux is usually a colourless or pale, clear liquid. Cloudiness, separation, sediment or marked discolouration usually means components have precipitated, absorbed moisture or been contaminated; quarantine first, then investigate.
- Solids content: the share of non-volatile material left after the solvent evaporates. Too high means more residue and white or tacky areas around joints; too low means too little active material and cold joints. Note that TDS solids figures are sometimes "theoretical" and differ from measured values, so it is best to establish a measured baseline with one method during qualification.
- Specific gravity / density: quick to measure and commonly used for incoming checks and in-line monitoring. But for low-solids flux it is very insensitive to concentration changes (see the estimate below).
- Acid value: the milligrams of potassium hydroxide needed to neutralise one gram of flux, directly reflecting organic acid activator content. Too high means strong activity but higher residue corrosion risk; too low means weak oxide removal. For low-solids flux, acid value is a more sensitive concentration indicator than specific gravity.
- pH: some data sheets give the pH after dilution as a supplementary indicator of acidity. It reflects something different from acid value, and the two cannot replace each other.
- Flash point / boiling point: related to safety and evaporation behaviour. Alcohol-based fluxes usually have very low flash points and are flammable liquids; storage and equipment explosion protection must reflect this.
To make this concrete, here are typical values from three public data sheets side by side:
| Product (public data) | Positioning | Solids | Acid value (mg KOH/g) | Specific gravity | J-STD-004 class |
|---|---|---|---|---|---|
| Kester SF800-LR | Dedicated PV module flux | ~1.5% (theoretical) | 13.4 (theoretical) | 0.799 | Not listed |
| ALPHA SF828-MBB | PV multi-busbar / fine round wire ribbon | 2.0% | 15.8 | 0.791 | ORL0 |
| AIM NC263UR | General-purpose liquid flux (reference) | 4.86% | 16.14 | 0.80 | ORM0 |
Table 1 Typical values from three flux data sheets
The three products differ by more than three times in solids content, yet their specific gravity sits almost entirely between 0.79 and 0.80. This is characteristic of low-solids flux: the density of the solvent (alcohols) sets the specific gravity, and the solid fraction is too small to shift it.
We estimated this with a simplified model: with 2% solids and isopropanol as the solvent, losing 10% of the solvent by evaporation raises the active concentration (roughly, the acid value) by about 11%, while specific gravity moves only from 0.7905 to 0.7911, less than 0.1%; at 20% solvent loss, acid value rises about 24% while specific gravity changes by only 0.17%.
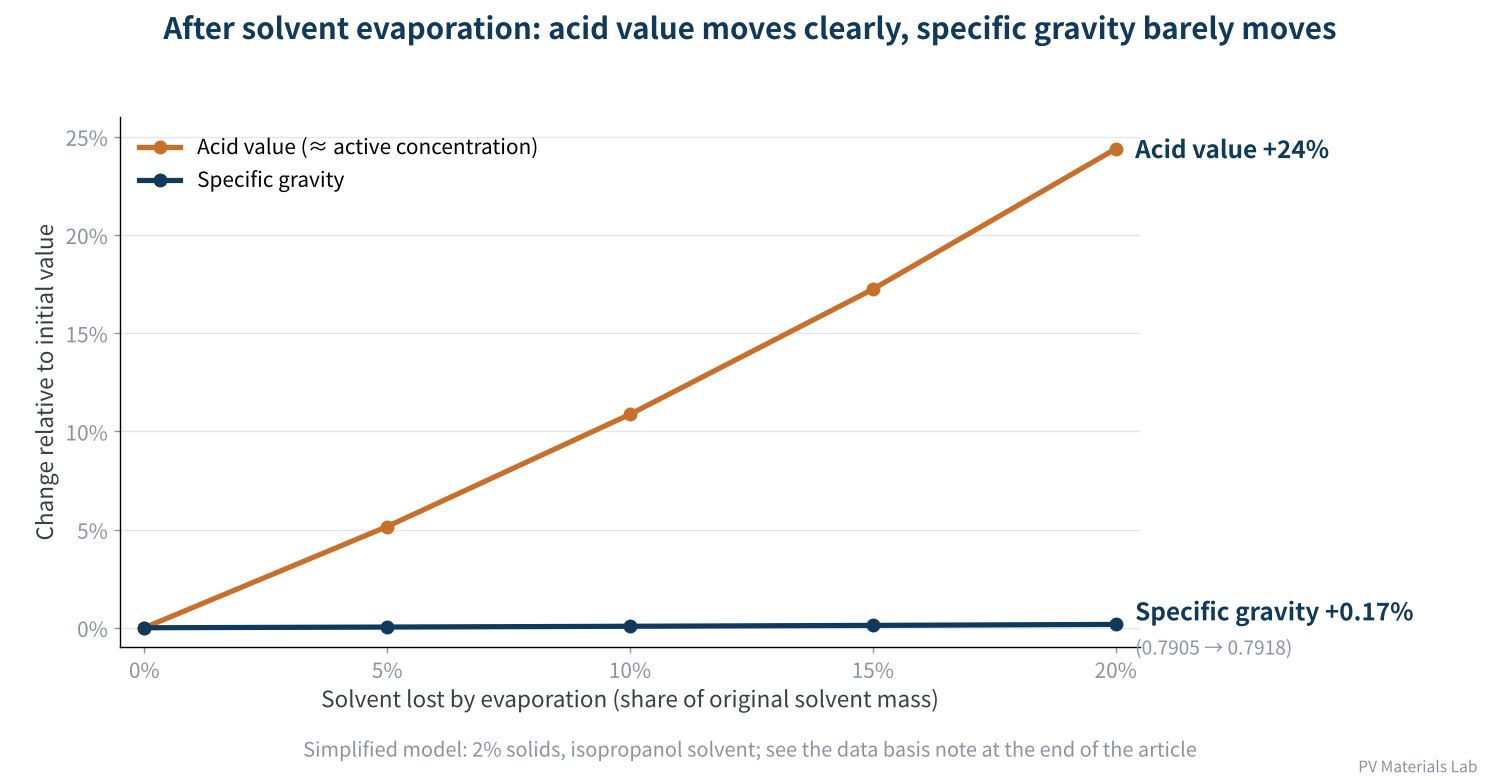
Figure 3 Effect of solvent evaporation on acid value and specific gravity (estimate)
Changes this small approach the reading resolution of many shop-floor hydrometers. Alcohol solvents also absorb water from the air, which pushes specific gravity upwards and muddies the picture further. That is why some suppliers state explicitly in their documentation that automatic control by specific gravity is often ineffective for low-solids flux, and recommend monitoring concentration by acid value titration and adding thinner at set intervals.
For low-solids flux, "specific gravity in spec" does not mean "concentration in spec". In-line monitoring should rely mainly on acid value, with specific gravity only as a supplementary reference.
03Group 2: soldering performance indicators — will it solder?
- Spread rate: a set amount of solder and flux is placed on a standard coupon, melted, and the extent of solder spreading is measured. The higher the spread rate, the better the flux helps solder spread. It is the classic solderability indicator, but its test conditions (solder, substrate, temperature) differ greatly from real stringing, so it is better for comparing fluxes with each other.
- Wetting time / wetting force: measured by wetting balance: a fluxed specimen is dipped into molten solder and the wetting force is recorded over time. Faster wetting and higher force are better. It shows "how fast", which is particularly useful for high-speed stringing.
- Solder pull (peel) force: strictly speaking not a flux property but the combined result of ribbon, cell, flux and process. Still, module makers' qualification ultimately comes down to it, combined with EL to check for cold joints.
A reminder: lab spread rate and wetting data are only a "first screen". What really decides whether a flux is usable is the pull force and EL from your own stringer, with your own ribbon and cells. We will cover these validation methods in the qualification article.
04Group 3: corrosion and reliability indicators — is it safe to leave behind?
This group looks at the "temperament" of the residue after soldering. In J-STD-004, these are also the main basis for assigning a flux's activity level (L/M/H).
- Halogen content: J-STD-004 uses 0.05% halide ions by weight of the solids to separate "0" from "1" — strictly "halide-free" versus "halide-containing". When comparing data, check the standard version (earlier versions had a looser threshold), and do not confuse this with the "halogen-free" measure of IEC 61249.
- Copper mirror corrosion: flux is placed on glass coated with vacuum-deposited copper and left at set temperature and humidity to see whether the copper film is "eaten through". Quick and visual, it gives a first indication of the residue's corrosion tendency.
- Corrosion test: soldered specimens are held in high temperature and humidity to see whether corrosion products or discolouration appear around the joints.
- Surface insulation resistance (SIR): flux is applied to comb electrodes and soldered, then a bias (25 V/mm) is applied under heat and humidity while insulation resistance between electrodes is monitored. The standard condition in J-STD-004C is 40 °C, 90% RH, 168 hours, with an optional 85 °C, 85% RH condition.
- Electrochemical migration (ECM): similar to SIR, but focused on whether metal dendrites grow between electrodes under long-term bias.
- Residue dryness: whether the residue after soldering is tacky or attracts dust. Tacky residue often means solvent or active components have not fully evaporated or decomposed.
Attentive readers will notice that the optional SIR condition of 85 °C/85% RH is the same as the module damp heat (DH) test. However, these tests evaluate comb electrodes on a PCB, which are not the same thing as cell fingers, transparent conductive films and passivation layers.
05Indicators PV data sheets often leave out
Having read many PV flux data sheets, we see a common pattern: physical-chemical indicators are listed in full, while the reliability indicators PV cares about most are often missing. The dedicated PV flux data sheet mentioned above, for instance, says only "zero halogen" without a measured value, and lists no copper mirror or SIR results. Some manufacturers are gradually adding more: another PV flux's data sheet, updated in 2026, gives the silver chromate result for halides and pass results for IEC 61249 and JEDEC low-halogen tests. Even so, module makers should request the following during qualification, or verify them themselves:
- Compatibility with EVA/POE: whether residue laminated with encapsulant yellows, bubbles or delaminates under UV and damp heat ageing.
- Cell-level damp heat sensitivity: UNSW's research recommends damp heat testing of unencapsulated cells before module encapsulation to screen quickly for a flux's corrosion risk to TOPCon and HJT cells.
- Measured halogen values: not just a "halogen-free" verdict, but actual values and test methods, for comparison with later batches.
- Batch stability: the spread of acid value, solids content and halogens across consecutive batches says more than one batch's "good-looking numbers".
Physical-chemical indicators govern batch consistency, soldering performance indicators govern whether it solders, and corrosion and reliability indicators govern whether it lasts two or three decades. Data sheets usually cover the first two fully; the third is exactly what PV should press on.
06Final thoughts
When reading a flux TDS/COA, remember three things:
- Know the document: the TDS gives typical values, the COA gives batch measurements, and acceptance needs a specification with limits;
- Track concentration by acid value: specific gravity is insensitive for low-solids flux, so put acid value first in in-line monitoring and incoming checks;
- Press on reliability: compatibility and damp heat corrosion, which PV cares about most, usually need to be requested separately or verified yourself.
This article covered "which indicators to look at". The next covers "how they are measured": what GB/T 9491, IPC J-STD-004 and its test methods, JIS and other standards specify; which items to test at incoming inspection, in type testing and during qualification; and simple tests a factory lab can do itself.
Which items does your incoming inspection test today? Have you ever had a batch with a fully compliant COA that still caused problems on the line? We would be glad to hear from you.
References
- MacDermid Alpha: Kester SF800-LR PV flux technical data sheet, 2021
- MacDermid Alpha: ALPHA SF828-MBB PV flux technical data sheet, April 2026
- AIM Solder: NC263UR liquid flux technical data sheet (Chinese), https://www.aimsolder.com/sites/default/files/nc263ur_liquid_flux_chinese_tds.pdf
- IPC J-STD-004C with Amendment 1, Requirements for Soldering Fluxes, IPC, 2022
- Indium Corporation: Breakdown of SIR Standards, https://www.indium.com/blog/breakdown-of-sir-standards/
- pv magazine: UNSW study shows impact of soldering flux on TOPCon solar cell degradation, 2025, https://www.pv-magazine-india.com/2025/08/18/unsw-study-shows-impact-of-soldering-flux-on-topcon-solar-cell-degradation
- GB/T 9491-2021 Soldering Fluxes, State Administration for Market Regulation and Standardization Administration of China, 2021 (in Chinese)
A PV R&D and technology team with 10+ years of experience | In-depth technical knowledge sharing
Materials · Reliability · Failure Analysis · Standards & Certification · Products · Processes
Exploring AI + PV; collaboration welcome
Disclaimer:
1. Original content reflects the authors' personal views only, is for reference only and does not constitute investment advice.
2. Reposted and cited content is credited to its source, out of respect for original work.
3. Some content was produced with AI assistance (chart generation, data retrieval, concept explanations, etc.); the core framework and key content were written by our technical team and reviewed by people.
4. If anything is inaccurate or infringes your rights, please leave a message or contact us and we will deal with it.